
Yesterday’s post provided topline statistics about internet access in North Carolina. For many readers, this post raised more questions than it answered. Specifically, one reader wanted to know how many individuals had internet access only through their cell phones. Others had more specific questions about the relationship between income, geography, and access. These questions are addressable with the data and are the focus of this post.
How many of the people with internet access are using cell phones only?
Accessing the internet on a cell phone only is a fundamentally more limited form of engagement with the internet than individuals who are accessing the internet on a desktop or laptop computer. According to the 2017 5-Year American Community Survey (ACS), 85.5% of households had one or more types of computing devices:
These estimates are likely to increase in coming years due to survey changes that better capture the use of these devices.*
Statewide, 76.4% of households had an internet subscription according to the (75.8% with broadband and 0.6% with dial-up). However, one in ten broadband users—7.5% of all households—reported having a “cellular data plan only with no other type of internet subscription.” The counties with the highest rates of cell-only internet access were:
The counties with the largest numbers of cell-only households were:
What is the relationship between income and internet access?
Nationwide analysis by the U.S. Census Bureau found that, across rural and urban categories, counties with lower median household incomes (<$50,000) had household internet subscription rates ten percentage points lower than counties with median household incomes of $50,000 or more. Yesterday’s post highlighted differential rates of internet access across North Carolina’s 100 counties and by race and ethnicity but did not discuss the key factor of income.
The interactive graphic below highlights the relationship between county median household income and the share of county households with any broadband subscription. Median income ranges from just under $31,300 in Bertie to more than $73,500 in Wake. Broadband subscription rates range from 44.9% in Swain to 88.3% in Wake. The shading of each dot reflects the share of county population identifying as American Indian, Black, or Hispanic. This proportion ranges from 3.3% in Madison to 71.9% in Robeson.
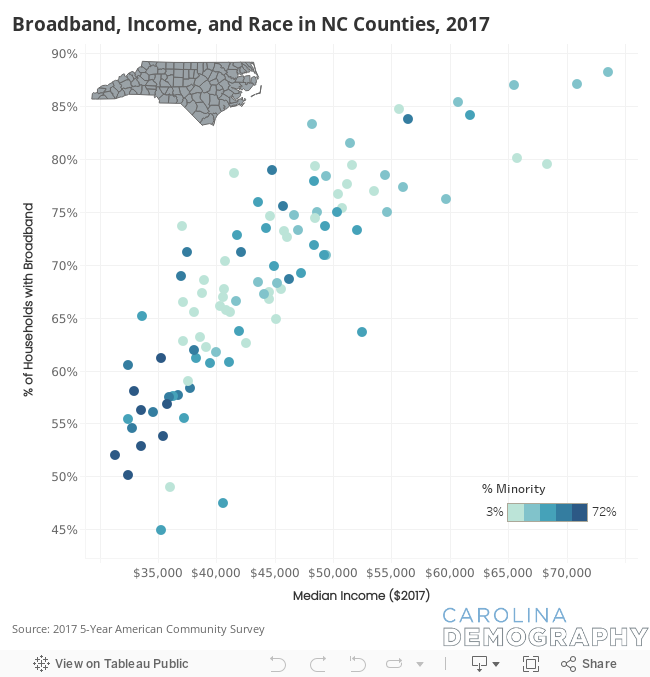
There is a strong relationship between median income and internet adoption. For every additional $1,000 in median income, the county’s broadband subscription rate increases by 0.9 percentage points.** With this new data and future releases, researchers will be better able to explore whether this is due primarily to a lack of sufficient infrastructure or more driven by individual characteristics such as age and income.
*The 2017 5-Year ACS data span 2013-2017 and include years of data collected prior to the survey changes. They are used here because they are the only source that provides estimates for all 100 counties in the state. The 2017 1-Year ACS data available at the state level found higher rates of smartphone only (8.7%) and tablet only households (1.0%), due to higher overall rates of device reporting (89.4% of households reported any computing device). In addition, nearly one in nine households (10.8%) reported having a cellular data plan only with no other type of internet subscription.
**Based on linear regression.
Need help understanding population change and its impacts on your community or business? Carolina Demography offers demographic research tailored to your needs.
Contact us today for a free initial consultation.
Contact UsCategories: Economic Data
Tags: American Community Survey, broadband, cell phones, digital divide, household income

The Center for Women’s Health Research (CWHR) at the University of North Carolina School of Medicine released the 12th edition of our North Carolina Women’s Health Report Card on May 9, 2022. This document is a progress report on the…

Dr. Krista Perreira is a health economist who studies disparities in health, education, and economic well-being. In collaboration with the Urban Institute, she recently co-led a study funded by the Kate B. Reynolds Foundation to study barriers to access to…

Our material helped the NC Local News Lab Fund better understand and then prioritize their funding to better serve existing and future grant recipients in North Carolina. The North Carolina Local News Lab Fund was established in 2017 to strengthen…
Your support is critical to our mission of measuring, understanding, and predicting population change and its impact. Donate to Carolina Demography today.