
Every decade, following the decennial Census, the 435 seats in the U.S. House of Representatives are allocated to the 50 states based on their population. After the 2000 Census, 12 House seats shifted between the states; another 12 seats shifted after the 2010 Census. Two years ago, we explored how ongoing population shifts might impact the reapportionment process following the 2020 Census. At that time, the most recent population estimates were for 2014. Today we offer an updated look on those projections based on the recently released 2017 population estimates.
If current population trends continue through 2020, North Carolina will pick up the 14th House seat it narrowly missed in 2010. Under the Huntington-Hill method used to apportion congressional seats, North Carolina’s 14th District would be the 426th seat apportioned based on a linear extrapolation of the 2017 population estimates. In total, there would be a shift of 9 seats: 6 Southern and Western states would gain seats (Texas would add 3 seats and Florida would add 2 seats) and 9 predominantly Midwestern and Northeastern states would each lose one seat.
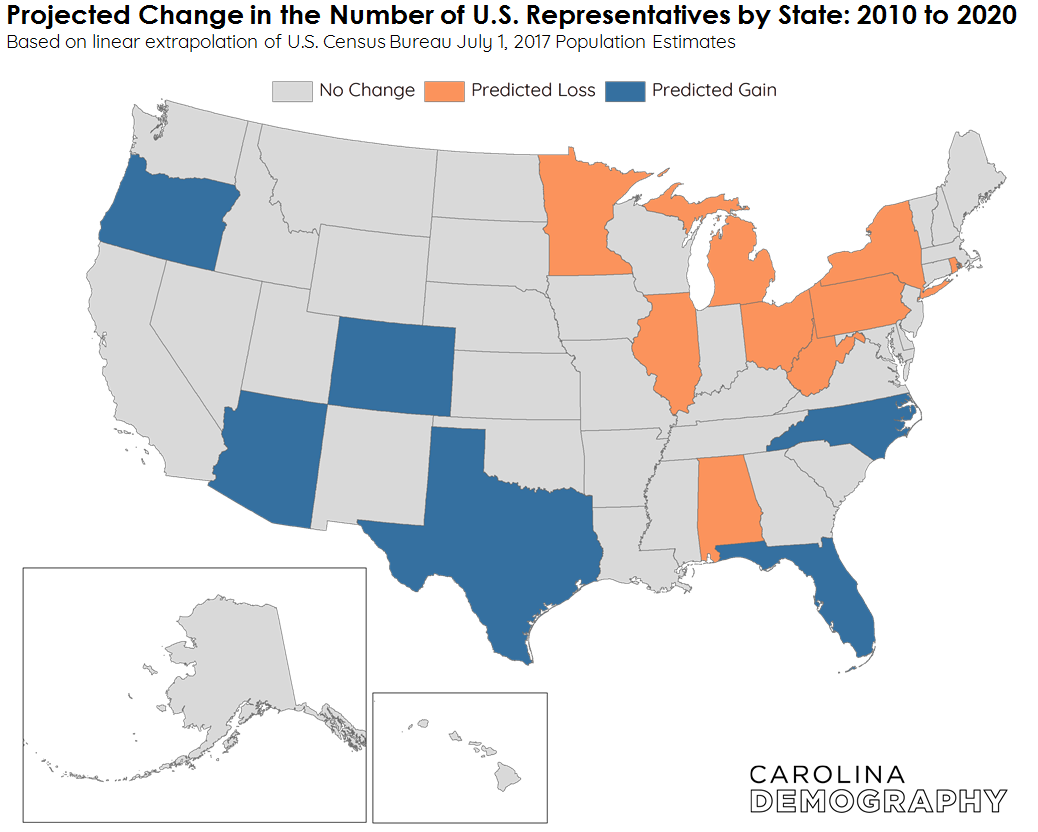
Here’s what is projected to happen based on population trends over the past 7 years:
Florida, North Carolina, and Texas would all gain seats based on current population trends. North Carolina would gain one seat while Florida could pick up 2 new seats and Texas may gain 3 additional seats.
Arizona, Colorado, and Oregon would each gain one seat in the U.S. House of Representatives if current population trends continue through 2020.
Between 2016-17, population growth occurred much faster in the Southern (1%) and Western (1%) regions of the United States than it did in the Midwest (0.3%) or Northeast (0.2%). This reflects a continuation of ongoing population shifts as U.S. residents have steadily relocated from Northeast and Midwest to the South and West. If trends continue, seven states in these two regions are projected to lose a congressional seat in 2020. These include Illinois, Michigan, Minnesota, and Ohio in the Midwest and New York, Pennsylvania, and Rhode Island in the Northeast.
Although the South has experienced strong regional growth, the Southern states do not equally share this growth. Two Southern states (based on U.S. Census Bureau regional classifications) are projected to lose a seat in 2020: Alabama and West Virginia. No Western states are currently projected to lose a representative in 2020.
In our 2015 analysis, we utilized the 2014 population estimates in conjunction with both state-produced population projections and projections derived from longer-term trends. While the current analysis evaluates only projections based on the 2017 population estimates, the results are generally consistent with the analysis completed in 2015. The table below highlights in bold the states where the 2017 predictions differ from 2015.
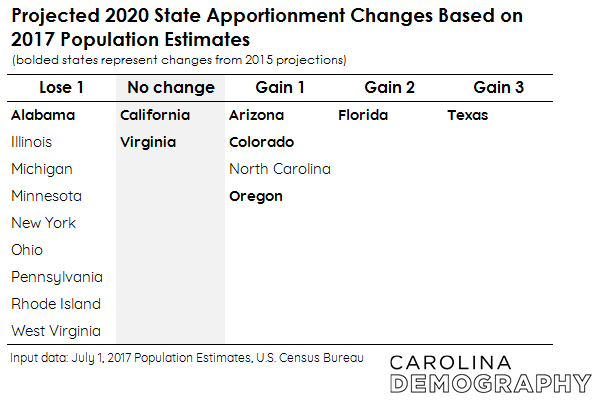
In 2015, our projections suggested the following scenarios that were different for the states in bold: Alabama (no change), Arizona (leans +1), California (leans +1), Colorado (leans +1), Florida (+1), Oregon (leans +1), Texas (+2), Virginia (+1).
For Alabama, persistent slow growth since 2010 has shifted it into the “Lose 1” category. Slow-downs in the growth rate of California and Virginia lead current projections to predict “no change,” while growth in Arizona, Colorado, and Oregon has continued steadily.
These projections are purely extrapolations of the population growth and change observed in the 2017 population estimates. The official 2020 Census count used for Congressional apportionment may differ from these projections for multiple reasons.
First, population trends can change significantly in ways that are inconsistent with prior trends. For example, North Dakota was among the fastest-growing states through 2015 and has lost population for the past two years. Second, these are population estimates; we will not know how close they are to the true count until the completion of the 2020 Census. Related to this, concerns about the risk of undercount in the 2020 Census and state-to-state differences in the prevalence of hard-to-count populations (see map) could influence reapportionment outcomes.
Projections to April 1, 2020 were calculated through the linear extrapolation total change from April 1, 2010 through July 1, 2017. Congressional seats were allocated based on the Huntington-Hill method.
Need help understanding population change and its impacts on your community or business? Carolina Demography offers demographic research tailored to your needs.
Contact us today for a free initial consultation.
Contact UsCategories: Census 2020, Elections & Voting
Tags: 2017 population estimates, 2020 census, projections, reapportionment, U.S. House of Representatives

The Center for Women’s Health Research (CWHR) at the University of North Carolina School of Medicine released the 12th edition of our North Carolina Women’s Health Report Card on May 9, 2022. This document is a progress report on the…

Dr. Krista Perreira is a health economist who studies disparities in health, education, and economic well-being. In collaboration with the Urban Institute, she recently co-led a study funded by the Kate B. Reynolds Foundation to study barriers to access to…

Our material helped the NC Local News Lab Fund better understand and then prioritize their funding to better serve existing and future grant recipients in North Carolina. The North Carolina Local News Lab Fund was established in 2017 to strengthen…
Your support is critical to our mission of measuring, understanding, and predicting population change and its impact. Donate to Carolina Demography today.