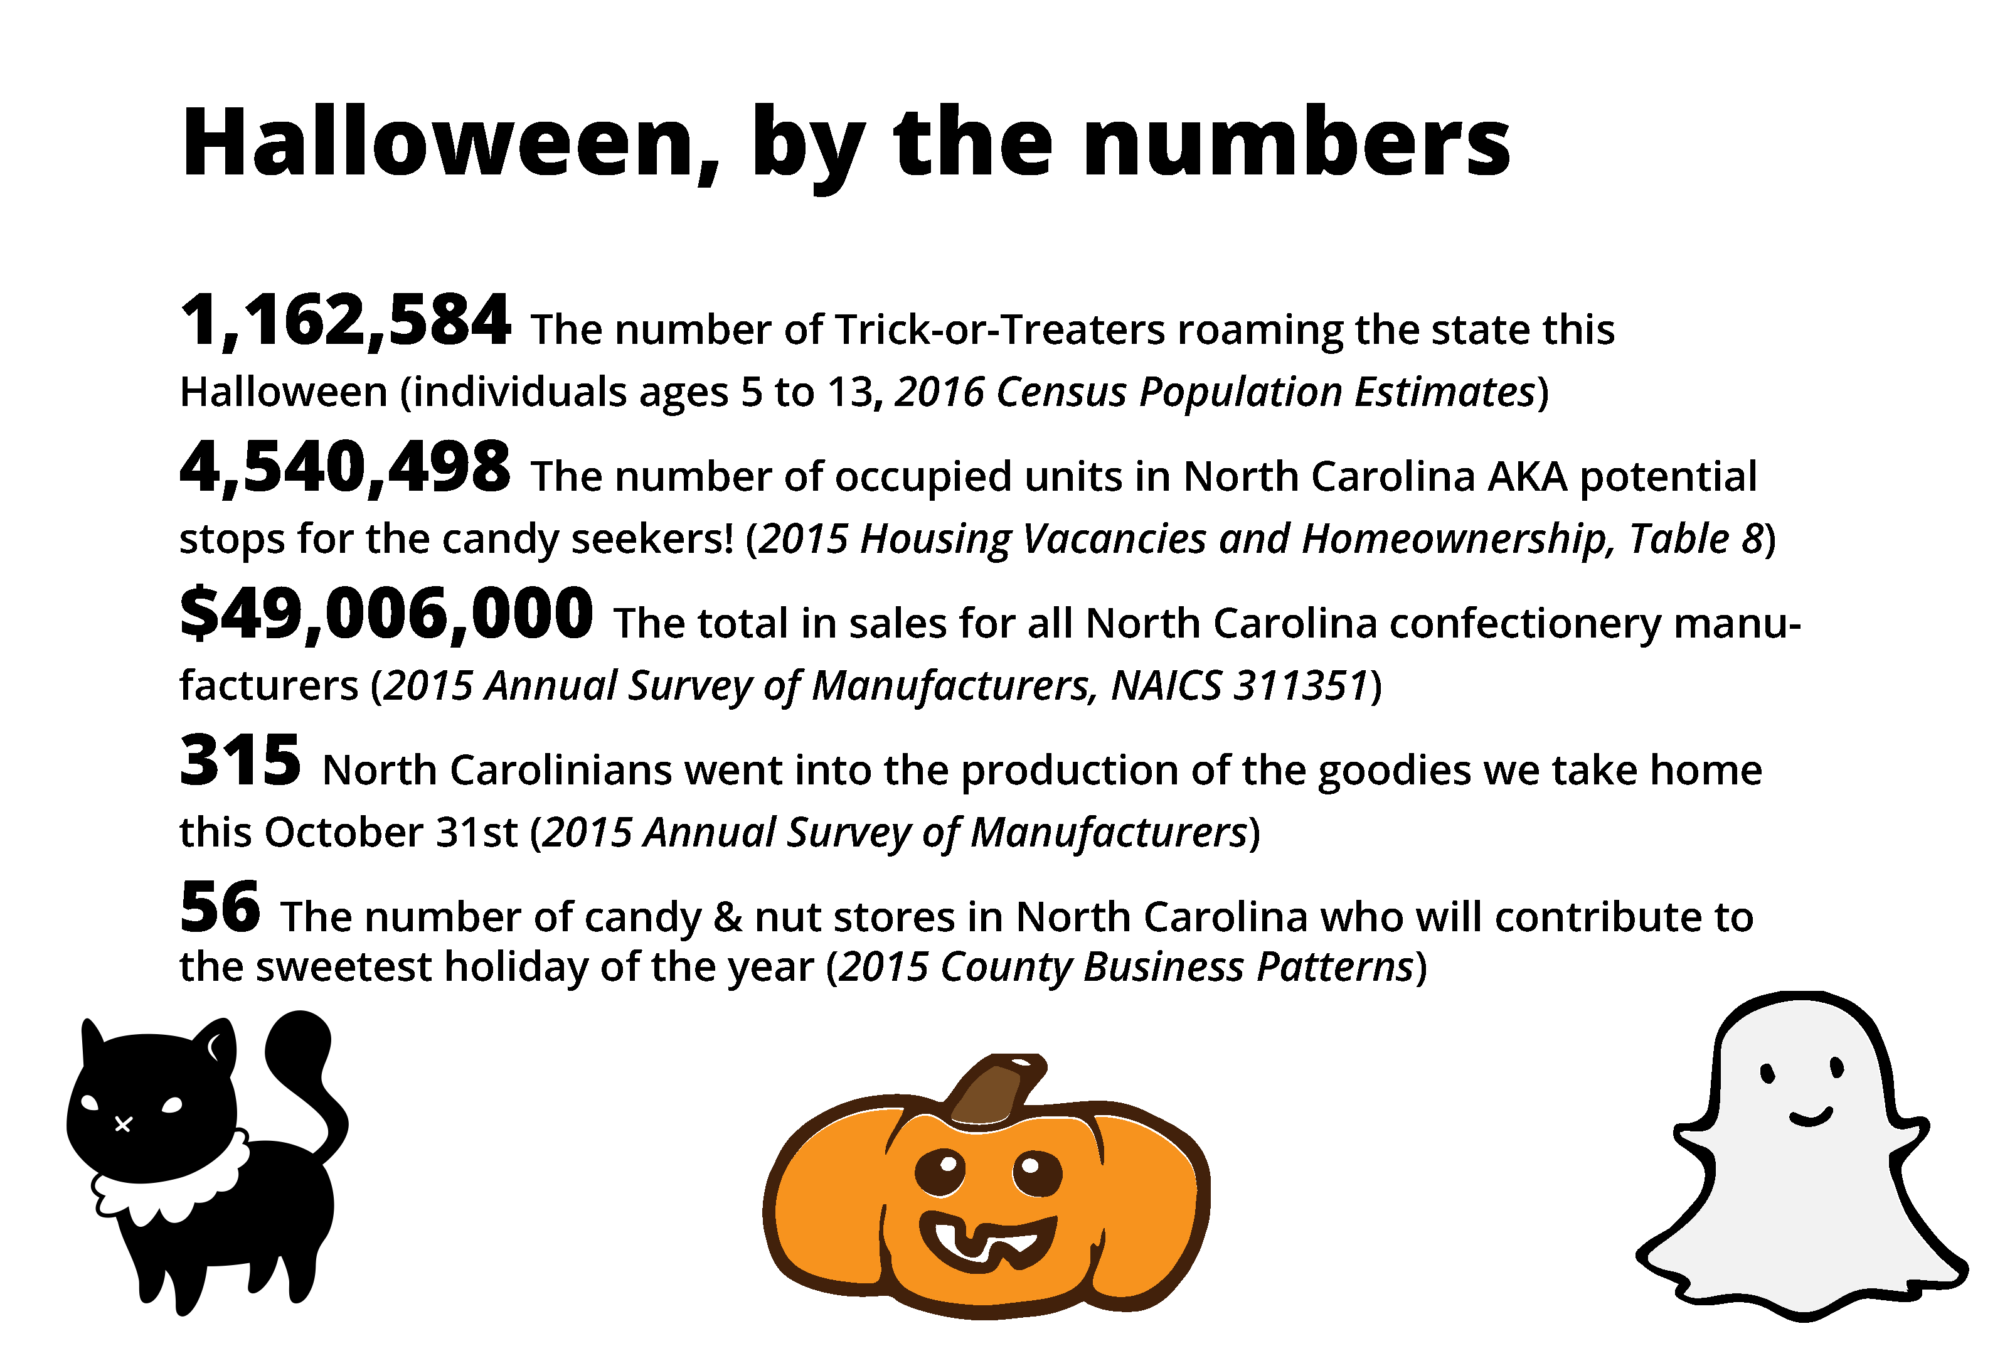
As the month of October comes to a close, we reach the first holiday of the autumn season: Halloween. To help you prepare, we’ve put together a guide to the number of trick-or-treaters in the state this year, and a map of where one can expect to get the most visitors! We’ve also run the numbers on North Carolina’s contribution to the holiday, by way of its numerous candy factories and stores.
This year, we took inspiration from the Census Mapper team in Canada who have mapped trick-or-treaters in the Vancouver area by density and by total children per dwelling for the last several years.
Below, you will find our own map featuring the census tracts which make up several of North Carolina’s cities. Each census tract displays its trick-or-treater density: the number of children of trick-or-treating age (5-14 years old) per square kilometer. When clicked on, the census tract will list the total children located there, the density of the tract, and the age breakdown of the potential trick-or-treaters. Due to limited memory, we chose to highlight the cities in North Carolina with the greatest density of trick-or-treaters.
Need help understanding population change and its impacts on your community or business? Carolina Demography offers demographic research tailored to your needs.
Contact us today for a free initial consultation.
Contact UsCategories: Fun Maps, NC in Focus
Tags: 2017, American Community Survey, Halloween, trick-or-treaters

The Center for Women’s Health Research (CWHR) at the University of North Carolina School of Medicine released the 12th edition of our North Carolina Women’s Health Report Card on May 9, 2022. This document is a progress report on the…

Dr. Krista Perreira is a health economist who studies disparities in health, education, and economic well-being. In collaboration with the Urban Institute, she recently co-led a study funded by the Kate B. Reynolds Foundation to study barriers to access to…

Our material helped the NC Local News Lab Fund better understand and then prioritize their funding to better serve existing and future grant recipients in North Carolina. The North Carolina Local News Lab Fund was established in 2017 to strengthen…
Your support is critical to our mission of measuring, understanding, and predicting population change and its impact. Donate to Carolina Demography today.