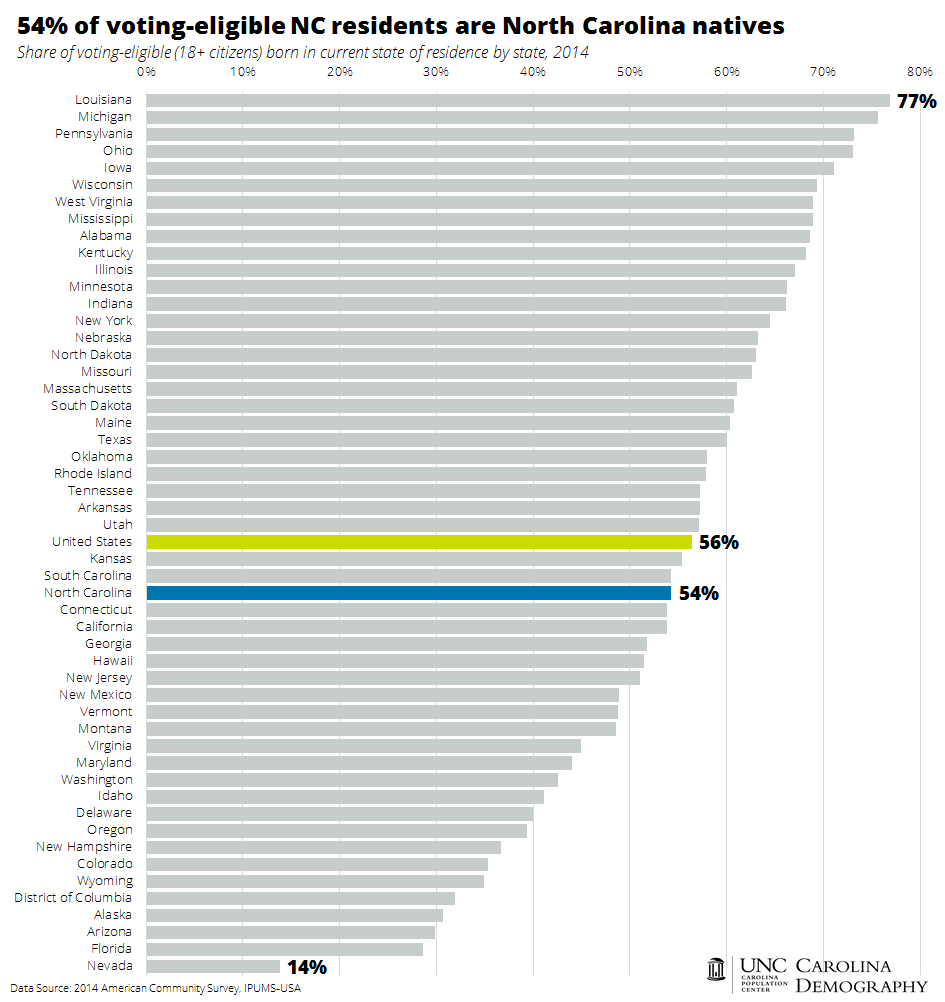
Over half (54%) of North Carolina’s voting-eligible (18+ citizen) population is North Carolina born, according to estimates from the 2014 American Community Survey. This is slightly below the national proportion of 56% of eligible voters born in their current state of residence. Louisiana has the highest proportion of state native potential voters at 77% while Nevada has by far the lowest rate. Just 14% of Nevada’s voting-eligible residents were born in Nevada.
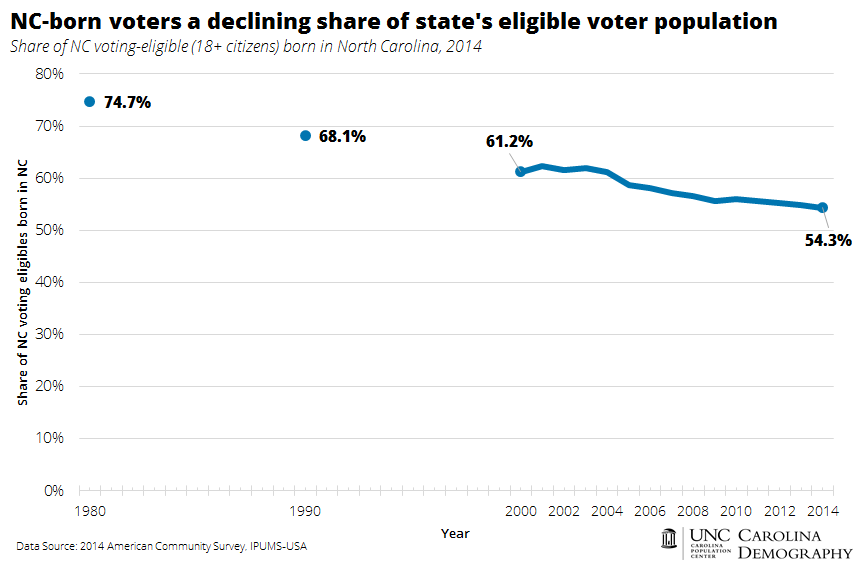
As individuals moved to North Carolina from other states and countries over the past few decades, the state share of North Carolina-born potential voters has declined. In 1980, three of every four (75%) of North Carolina’s voting-eligible population were born in North Carolina. As the state’s population grew from in-migration, this share declined to 68% by 1990 and 61% by 2000. The share of NC-born potential voters held steady for the first part of the 2000s and then began to decline again, reaching 54% in 2014.
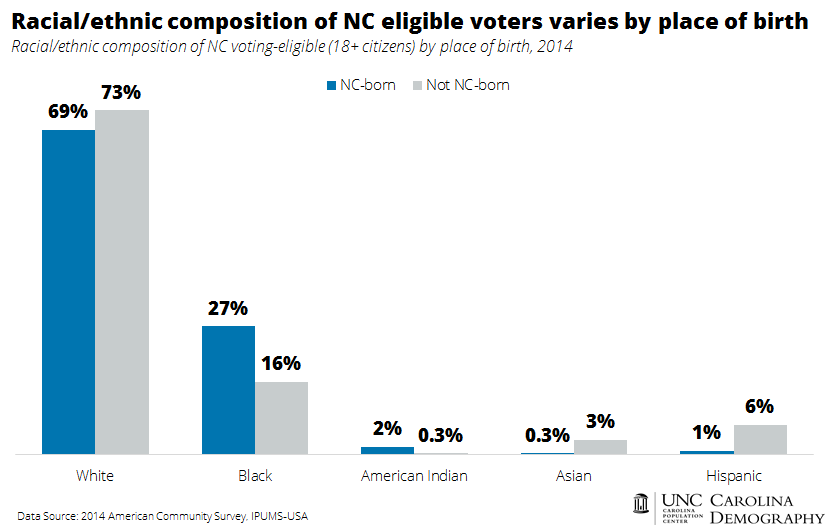
North Carolina-born potential voters living in the state are more likely to be black or American Indian, while voting eligible adults born in another state or country are more likely to be Asian, Hispanic, or white. More than one in four (27%) of NC-born eligible voters is black or African American compared to 16% of voting eligible adults born elsewhere. American Indians comprise two percent of NC-born eligible voters compared to just 0.3% of non-NC-born eligible voters. In contrast, non-NC born eligible voters have a higher share of Asian (3% vs 0.3%), Hispanic (6% vs 1%), and white (73% vs 69%) individuals.
Interested in more? Read about where NC’s registered voters were born.
Your support is critical to our mission of measuring, understanding, and predicting population change and its impact. Donate to Carolina Demography today.