North Carolina’s population is rapidly diversifying. Since 2000, the state’s Asian population has more than doubled, increasing from 114,000 to 268,000, a growth rate of 136%. The Hispanic population has grown at a similar pace, with even more significant numeric increases. In 2000, North Carolina had 379,000 Hispanic residents. By 2015, the Hispanic population was nearly 912,000, an increase of more than half a million or 141% over fifteen years.
This diversity is not fully reflected in the state’s electorate, however. Just 2.3% of North Carolina’s active, registered voters identify as Hispanic compared to 9.1% of the total population. Similarly, Asian voters comprised 1.1% of North Carolina registered voters while making up 2.7% of the total population. What accounts for these differences?
First, North Carolina’s Asian and Hispanic residents are younger than the national average, making them more likely to be ineligible to vote due to age. In 2015:
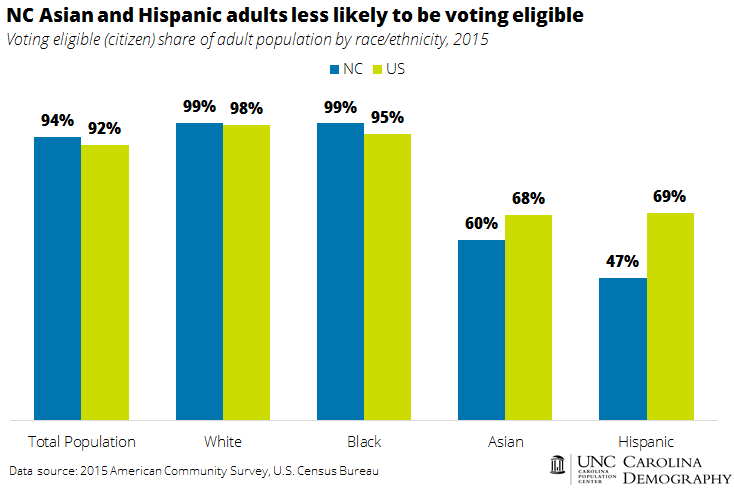
In addition, North Carolina Asian and Hispanic adults are less likely to be eligible to vote due to citizenship status. Nearly all of North Carolina black and white adults are eligible to vote (9%). In contrast, just 60% of North Carolina’s Asian adults are citizens compared to 68% of Asians nationwide. Less than half of North Carolina’s Hispanic adults are citizens—47%—the lowest rate of any state in the nation.
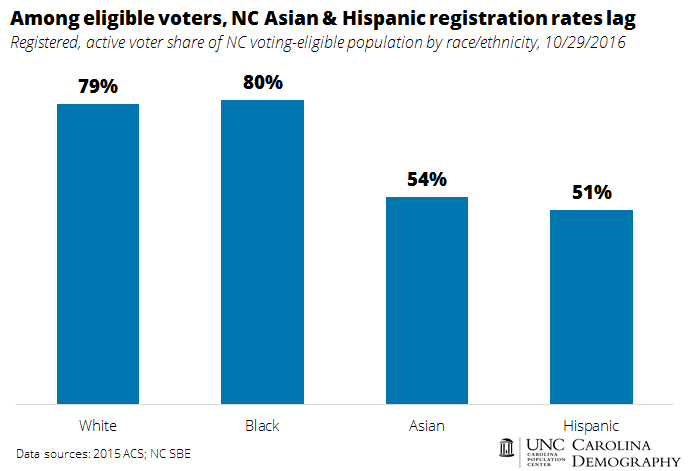
Among the voting eligible populations, current voter registration data indicates lower registration rates among Asian and Hispanic adults. Eighty percent of voting eligible black North Carolinians were active, registered voters as of October 29th, 2016, the highest rate of any group. Non-Hispanic whites had rates nearly as high: 79%. In contrast, just 54% of voting eligible Asians were active, registered voters. At 51%, Hispanic registration rates were even lower.
In part due to these differences in age structure, citizenship status, and registration rates, North Carolina has fewer Asian and Hispanic voters than most similarly sized states. North Carolina has the 9th largest potential electorate—7.3 million citizens 18 and older—but the state’s potential Hispanic and Asian voters are only the 17th largest among the states, according to 2015 estimates from the American Community Survey. Among the 13 states with 5 million or more potential voters, only Ohio has fewer voting-eligible Asian residents (99K vs. 123K), while just Ohio (209K) and Michigan (236K) have fewer voting-eligible Hispanics than North Carolina (266K).
Note: The 13 states with 5 million or more potential voters (citizens 18+) in 2015 were California, Texas, Florida, New York, Pennsylvania, Illinois, Ohio, Michigan, North Carolina, Georgia, New Jersey, Virginia, and Washington.
Your support is critical to our mission of measuring, understanding, and predicting population change and its impact. Donate to Carolina Demography today.