NC in Focus: Who are NC’s Republican voters?
As of October 1st, North Carolina had 5.6 million active, registered voters. Of these, 1.8 million or 31% were registered as Republican.
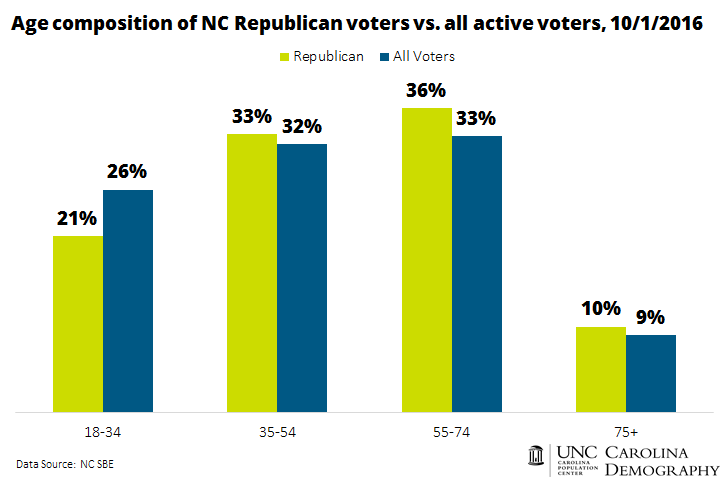
Younger voters are the least likely to register as Republican, reflecting their higher affinity for registering unaffiliated. Just 25% of voters ages 18-34 are registered Republican compared to 32% of 35-54 year-olds, 34% of 55-74 year-olds, and 35% of voters ages 75 and older. As a result, older adults, especially those ages 55-74, comprise a larger share of Republican voters than the overall electorate (36% vs. 33%).
North Carolina’s registered Republicans have generally been in the state slightly longer than non-registered Republicans. Just 33% of Republican voters first registered in 2010 or later compared to 41% of non-Republican voters. Fully 20% of the state’s Republican voters first registered to vote in North Carolina prior to 1990.
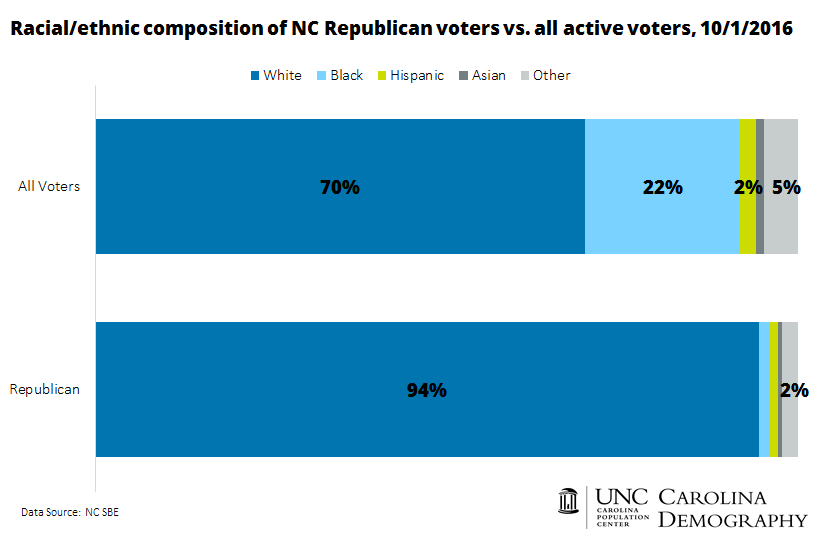
North Carolina’s registered Republicans are overwhelmingly white. Ninety-four percent of Republican voters are white compared to 70% of the electorate overall. White voters are significantly more likely to register as Republican (42%) compared to other groups. Sixteen percent of Asian voters, 15% of both Hispanic and American Indian voters, and just 2% of black voters are registered Republican in North Carolina.
North Carolina voters born in a Midwestern state are generally the most likely to be registered as Republican. Forty-three percent of South Dakota-born individuals were registered Republican, followed by West Virginia (41%), and Kentucky (40%). Thirty-nine percent of NC voters born in Oklahoma, Nebraska, Indiana, and Utah are registered Republican.
Nearly 783,000 Republican voters—45% of the Republican voter population—were born in North Carolina. New York (84K), Virginia (60K), Pennsylvania (53K), Ohio (41K), other countries (41K), and Florida (41K) were the next most common birth places. Thirteen percent of Republican voters (234K) provided no information on place of birth.
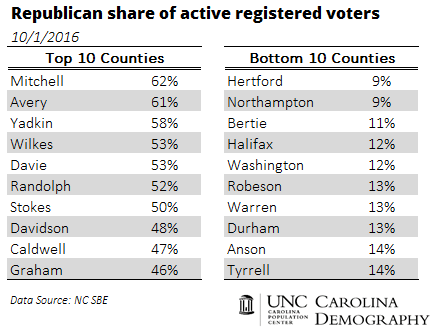
Across North Carolina’s 100 counties, the county share of Republican voters varies widely, reflecting county differences in composition by age, race/ethnicity, and place of birth. Voters in western counties are generally more likely to register Republican while those in northeastern counties are generally least likely to register as Republican. Sixty-two percent of active voters in Mitchell County were registered Republican, the highest rate statewide. Over half of registered voters were registered Republican in five other counties: Avery, Yadkin, Wilkes, Davie, and Randolph.
In contrast, less than 1 in 10 voters is registered Republican in Hertford or Northampton counties.
Your support is critical to our mission of measuring, understanding, and predicting population change and its impact. Donate to Carolina Demography today.