We originally discussed reapportionment and redistricting in North Carolina in a series of posts in November 2015. To reflect the newly redrawn congressional maps, we updated our 2014 population estimates for congressional districts. This post updates the 2020 population projections for North Carolina’s congressional districts.
North Carolina will likely have 14 seats in the U.S. House of Representatives following the post-2020 Census reapportionment process. While we cannot guarantee a 14th seat (no matter how likely), we can guarantee significant changes to the state’s congressional district boundaries during the 2021 redistricting process.
North Carolina’s population has grown substantially in the past few decades, and it continues to grow. At the same time, population is increasingly concentrated in urban cores within the state and rural areas are facing additional population losses. As a consequence of these uneven population changes, many districts were already over or under ideal district size in 2014, in spite of their equal populations using 2010 decennial census counts. Unless current population growth trends change in significant and unexpected directions, these patterns will intensify through 2020, bringing significant changes to the state’s legislative maps during the redistricting process.
Projected 2020 Population for NC’s 13 Congressional Districts
While we are not be able to identify where the state’s likely 14th House seat will go, we can use demographic techniques to predict which districts will be out of compliance—and by how much—in 2020. We produced three population projections to examine potential district size in 2020:
Each of these projections was constrained to the most recent 2020 state population projection from North Carolina’s Office of State Budget and Management: 10,574,718. Additional methodological details are provided in the Appendix.
The table below details the observed population of each congressional district in the 2000 Census, the 2010 Census, and the 2014 population estimates, as well as the projected 2020 population under the four approaches described above. All data reflect population in the current district boundaries. (A labeled map of current district boundaries and data associated with the new district boundaries can be accessed here).
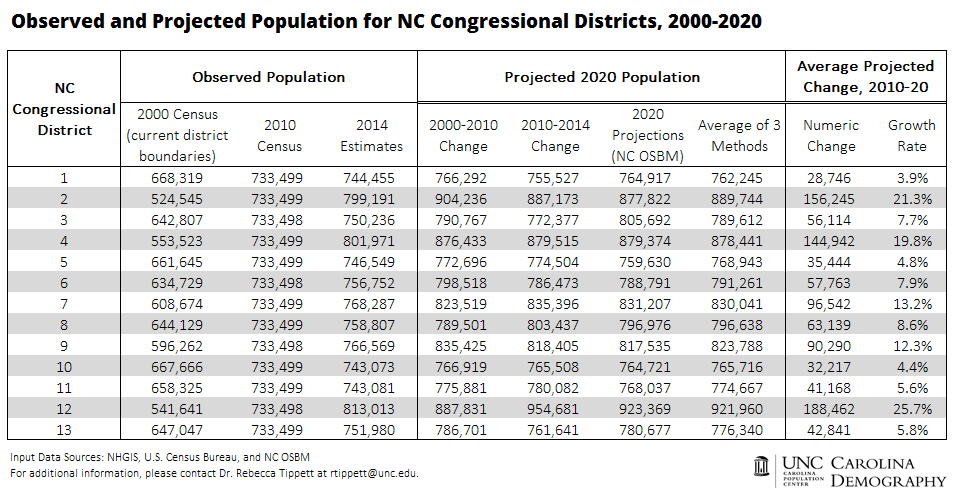
Observed Growth Trends
The 2010 total population of North Carolina’s 13 congressional districts differed by only one person: districts 3, 6, 9, and 12 had 733,498 residents; the remaining districts had 733,499 residents. A comparison of the 2010 population to the 2000 population reveals significant differences in district population growth over the preceding decade. District 1 on the Virginia border and in the northeastern region of the state and District 10 on the South Carolina border between Asheville and Charlotte grew by about 10% over the decade, each gaining just over 65,000 new residents. In contrast, District 2, which contains large portions of Raleigh suburbs in Wake and fast-growing Johnston and Harnett counties, grew by nearly 210,000 or 40% over the same time period.
By 2014, the continuation of these differential growth patterns was already evident. In the 2014 population estimates, North Carolina’s districts ranged from an estimated population of just over 743,000 in District 10 to more than 813,000 in District 12 (Charlotte/Mecklenburg).
Projected Growth Trends
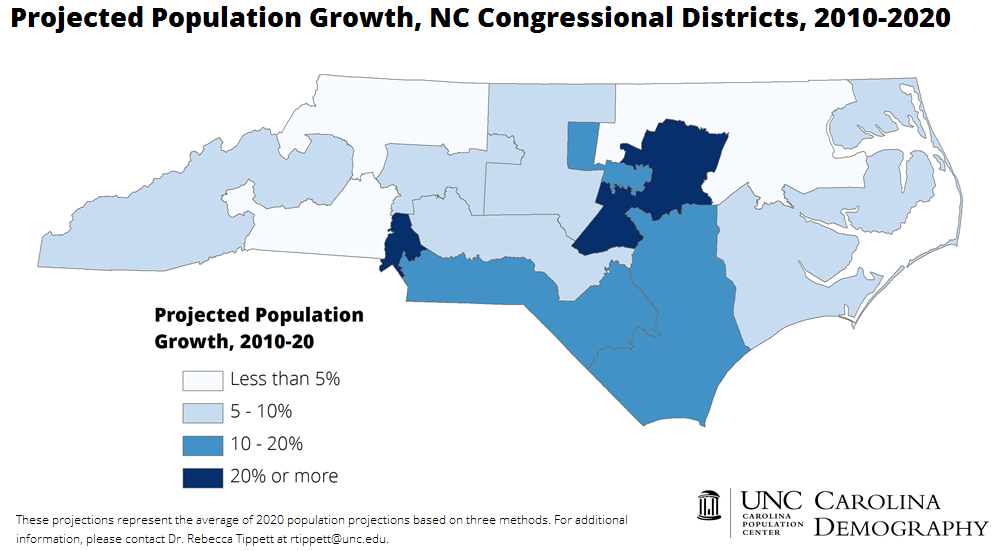
North Carolina is projected to add just over 1 million new residents between 2010 and 2020, a growth rate of 11%. Among its 13 congressional districts, eight are projected to have growth rates below the statewide average (Districts 1, 3, 5, 6, 8, 10, 11, and 13), while the remaining five (Districts 2, 4, 7, 9, and 12) are projected to grow at a faster pace than the state.
Although differences in the projected 2020 population exist across the approaches considered, some general patterns emerge. For example, District 1 grows by about 22,000 people (3%) in the extrapolation of 2010-2014 population change, but gains nearly 33,000 (4.5%) under the extrapolation of 2000-2010 population change. On average, District 1 is projected to gain just under 29,000 people, an increase of 3.9%. Regardless of the level of growth, District 1 is projected to have the smallest district population in three of the four approaches.
Similarly, District 12 was the second fastest growing district between 2000 and 2010, and it is projected to experience continued rapid growth under all methods considered here. It is projected to gain anywhere from 154,000 new residents in the extrapolation of 2010-2010 population change to nearly 222,000 new residents in the extrapolation of 2000-2014 change. On average, District 12 is projected to experience population growth of about 188,500 or nearly 26%.
Deviation from Ideal District Size in 2020
North Carolina’s population is projected to reach nearly 10.6 million in 2020. Split equally among 13 congressional districts, this yields an ideal population size of 813,440. If North Carolina picks up a 14th seat during the reapportionment process, the ideal population size of each district would be smaller, 755,337.
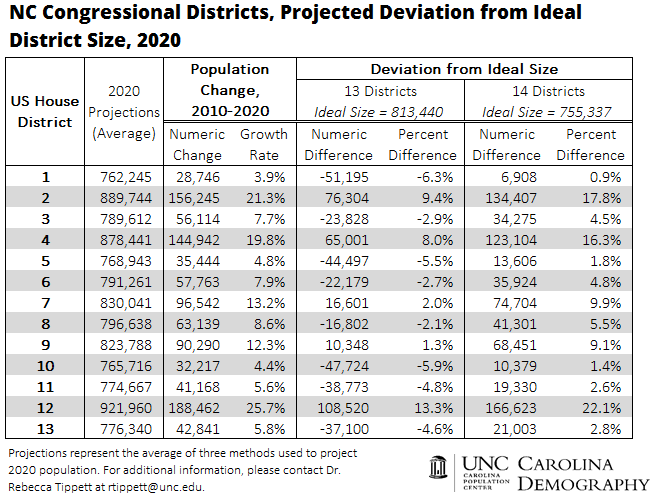
Whether North Carolina has 13 seats or 14 seats in 2020, all of its congressional districts will deviate significantly from equal population in 2020 under the projections considered here. If North Carolina stays at 13 seats in the House of Representatives, eight districts will be under populated, and will need to expand their boundaries to meet ideal population size. If North Carolina gains a 14th seat, all districts will be above ideal population size. The slower growing District 1 will be the closest to ideal size, while faster-growing districts like Districts 2, 4, and 12 will have populations more than 100,000 residents above ideal population size in the 14 seat scenario.
Where will a 14th Congressional district go?
The districts in the state’s two fastest-growing metropolitan areas—District 12 in Charlotte and Districts 2 and 4 and 13 in the Triangle—are projected to be significantly above the ideal population size for 14 districts in 2020. Any new district boundaries will reflect the continued growth of the state’s largest urban areas. While the projections highlight which areas will need more representation (and thus more districts) after 2020, the placement of the districts is ultimately up to the individuals responsible for redrawing the district lines during the 2021 redistricting process.
Your support is critical to our mission of measuring, understanding, and predicting population change and its impact. Donate to Carolina Demography today.