North and South Carolina have grown significantly faster than the nation since 2000, and their growth is projected to continue. This population growth has not occurred evenly across the counties, however, and the coming decade will likely show sharpening distinctions in population growth patterns. Here’s a quick look at what is projected to occur in the Carolinas during this decade (2010-2020) and what current population estimates can tell us about population growth in these states.
Between 2010 and 2020, the U.S. Census Bureau projects that the United States will gain nearly 26 million new residents, an increase of about 8.3%. South Carolina is projected to grow at a similar rate (8.5%); it is projected to gain nearly 400,000 new residents and surpass 5 million by 2020. North Carolina is projected to grow faster, increasing by nearly 11% and gaining more than 1 million new residents to reach a population of nearly 10.6 million.
This growth is projected to be highly uneven across North Carolina. Virtually all (99%) of the state’s growth is projected to occur in counties that belong to either metropolitan or micropolitan areas. Examining Combined Statistical Areas (CSAs)* suggests that two-thirds of North Carolina’s population growth will occur in either the broader Charlotte region (33% of state growth) or the Triangle region (34%). In Charlotte, this is fueled by projected growth rates of more than 20% in Mecklenburg, Union, and Cabarrus counties. In the Triangle, Wake, Harnett, and Durham counties are all projected to grow by more than 20%, as well. At the same time, 30 of North Carolina’s 100 counties are projected to lose population by 2020, a significant increase from the 7 counties that lost population between 2000 and 2010.
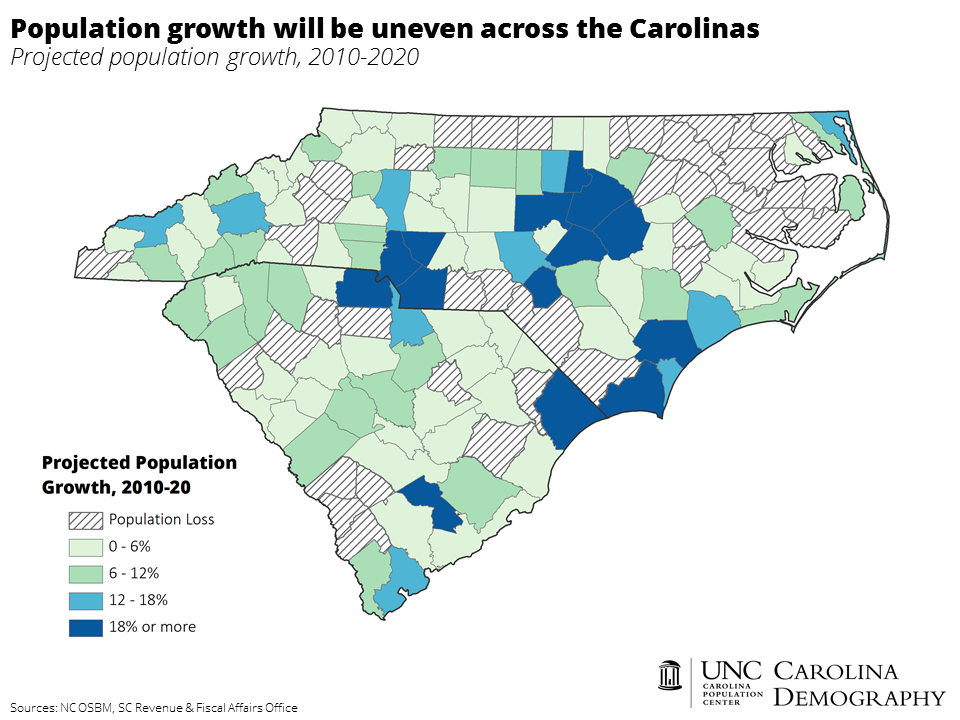
In comparison to North Carolina, South Carolina’s projected growth is more diffuse. Fewer counties are projected to grow as rapidly as many of the counties in North Carolina, but fewer counties are also projected to lose population.
In South Carolina, projected growth remains concentrated in metropolitan areas. Virtually all (99.8%) of the state’s projected growth is projected to occur within metropolitan or micropolitan counties, with nearly 60% projected to occur in three CSAs: Greenvillle-Spartanburg (22% of state growth), Columbia-Orangeburg-Newbury (19%), and Charleston (18%). Only 11 of South Carolina’s 46 counties are projected to lose population (24%), a slight decline from the 12 that lost population between 2000 and 2010.
Observed population growth patterns, as captured by the U.S. Census Bureau’s 2014 population estimates, reveal that population growth was even more uneven than projected.
Between 2010 and 2014, both states grew faster than the national rate of 3.3%. North Carolina gained more than 400,000 new residents, the 5th largest numeric gain among the states, and grew by 4.3%, the 13th highest growth rate. South Carolina had the 11th largest numeric increase in population (more than 200,000) and grew at a slightly faster rate than North Carolina, 4.5%, the 11th fastest growth rate among the states.
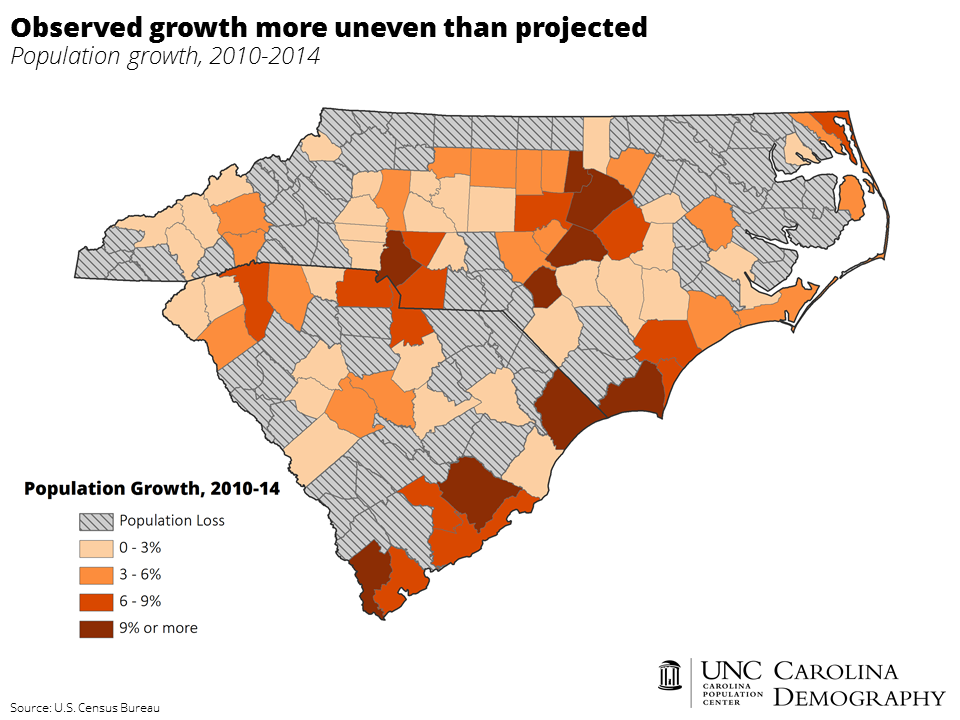
In North Carolina, the Triangle region accounted for a larger than projected share of state growth: 40% of growth between 2010 and 2014 occurred in this region compared to 34% of projected growth over the decade. Other large metro areas in the state, such as Charlotte, the Triad, Fayetteville, Asheville, and Wilmington, performed in line with projections. In contrast, metros like Rocky Mount, Rockingham, and non-metropolitan/non-micropolitan counties saw larger than projected population losses. In total, 49 of the state’s 100 counties have lost population since 2010.
The picture was similar in South Carolina: most metro areas performed on par with their projected share of state population growth, with the exception of Charleston. Charleston’s growth was greater than projected; between 2010 and 2014, the Charleston CSA gained 63,000 new residents, nearly as many as it was projected to gain over the entire decade (71,400). At the same time, twice as many counties lost population between 2010 and 2014 as were projected lose population over the decade. Twenty-two or 48% of South Carolina’s 46 counties have lost population since 2010.
*A Combined Statistical Area consists of adjacent metropolitan and micropolitan areas with demonstrated social and economic linkages.
Your support is critical to our mission of measuring, understanding, and predicting population change and its impact. Donate to Carolina Demography today.