December 21, 2017: This post provides an updated look at potential 2020 reapportionment shifts based on the July 1, 2017 population estimates.
Every decade, following the decennial Census, the 435 seats in the U.S. House of Representatives are allocated to the 50 states on the basis of their population. After the 2000 Census, 12 House seats shifted between 18 states. Ten states lost at least one representative while eight states gained at least one representative. Another 12 seats shifted between states following the 2010 Census. Although the specific changes differed from the prior decade, 10 states also lost at least one representative and eight gained at least one representative.
The 2020 Census will determine the apportionment of seats in the U.S. House of Representatives among the 50 states for the following decade, 2021-2031. Continued shifts in population between national regions and varying growth patterns across states will lead to more seat shifts in 2020. In 2010, North Carolina narrowly missed picking up another House seat. How many House seats is North Carolina likely to obtain in 2020? How might the seats of other states shift?
The recently released July 1, 2014 population estimates from the U.S. Census Bureau provide reliable insights into population trends, but many factors in the intervening years can have an impact on a state’s population on April 1, 2020 (Census Day). Some of these factors can be anticipated and extrapolated with reasonable confidence, such as long-term trends in population aging and net out-migration in states like West Virginia or the relatively strong population growth in states such as North Carolina and Texas. Other significant events are more difficult to predict, such as the impact Hurricane Katrina had on Louisiana’s overall population. Although the future cannot be known with certainty, political wonks and demographers can paint a reasonable picture of what might happen in the 2020 census and the subsequent reapportionment by using current population estimates and projections.
We examined multiple existing data sets and created some of our own to explore the range of potential outcomes in 2020. These sources include:
Additional detail on these data sources and methodologies are included the Appendix.
If apportionment were to occur today using the July 1, 2014 population estimates, North Carolina would pick up the 14th House seat it so narrowly missed in 2010. Under the Huntington-Hill method used to apportion congressional seats, North Carolina’s 14th District would be the 433rd seat apportioned based on the 2014 population estimates. In total, there would be a shift of 9 seats: 7 Southern and Western states would gain seats (Texas would add 3 seats) and 9 predominantly Midwestern and North Eastern states would each lose one seat.
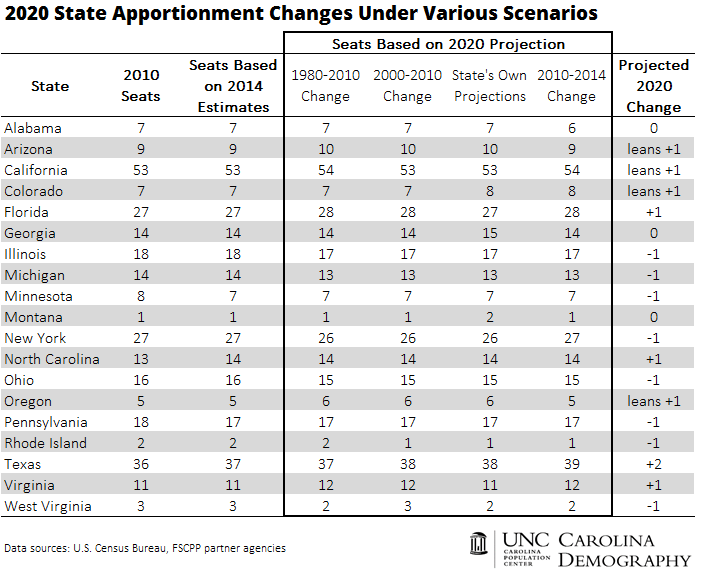
Under the four 2020 projections considered (indicated in the bold box in the above table), 19 states are projected to experience shifts in the number of House seats apportioned to them in at least one projection scenario. North Carolina secures a 14th seat under all four projections. Other states have similarly consistent performance across the four scenarios, suggesting a high likelihood of the projected shifts (highlighted in the map below).
Here’s what probably will—and probably won’t—happen based on what we currently know about population trends:
Florida, North Carolina, Texas, and Virginia are all projected to gain seats. Two of these states – North Carolina and Texas – are projected to gain seats under all four 2020 projection scenarios. North Carolina is projected to gain one additional seat, while Texas picks up an additional one, two, or three seats depending on the scenario. Virginia and Florida are projected to gain one additional seat in three of the four scenarios considered.
Arizona, California, Colorado, and Oregon each might add a seat in 2020. California gains a 54th district under two of the four extrapolation scenarios considered (the projections based on 1980-2010 growth and the projection 2010-2014 growth). Colorado is projected to add an 8th district under two scenarios, as well (its state produced projections and the projection of 2010-2014 growth). Oregon gains a 6th seat and Arizona gains a 10th seat in three of the four scenarios, but these states are classified as leaning +1 because they do not pick up additional seats based on an extrapolation of estimated 2010-2014 growth.
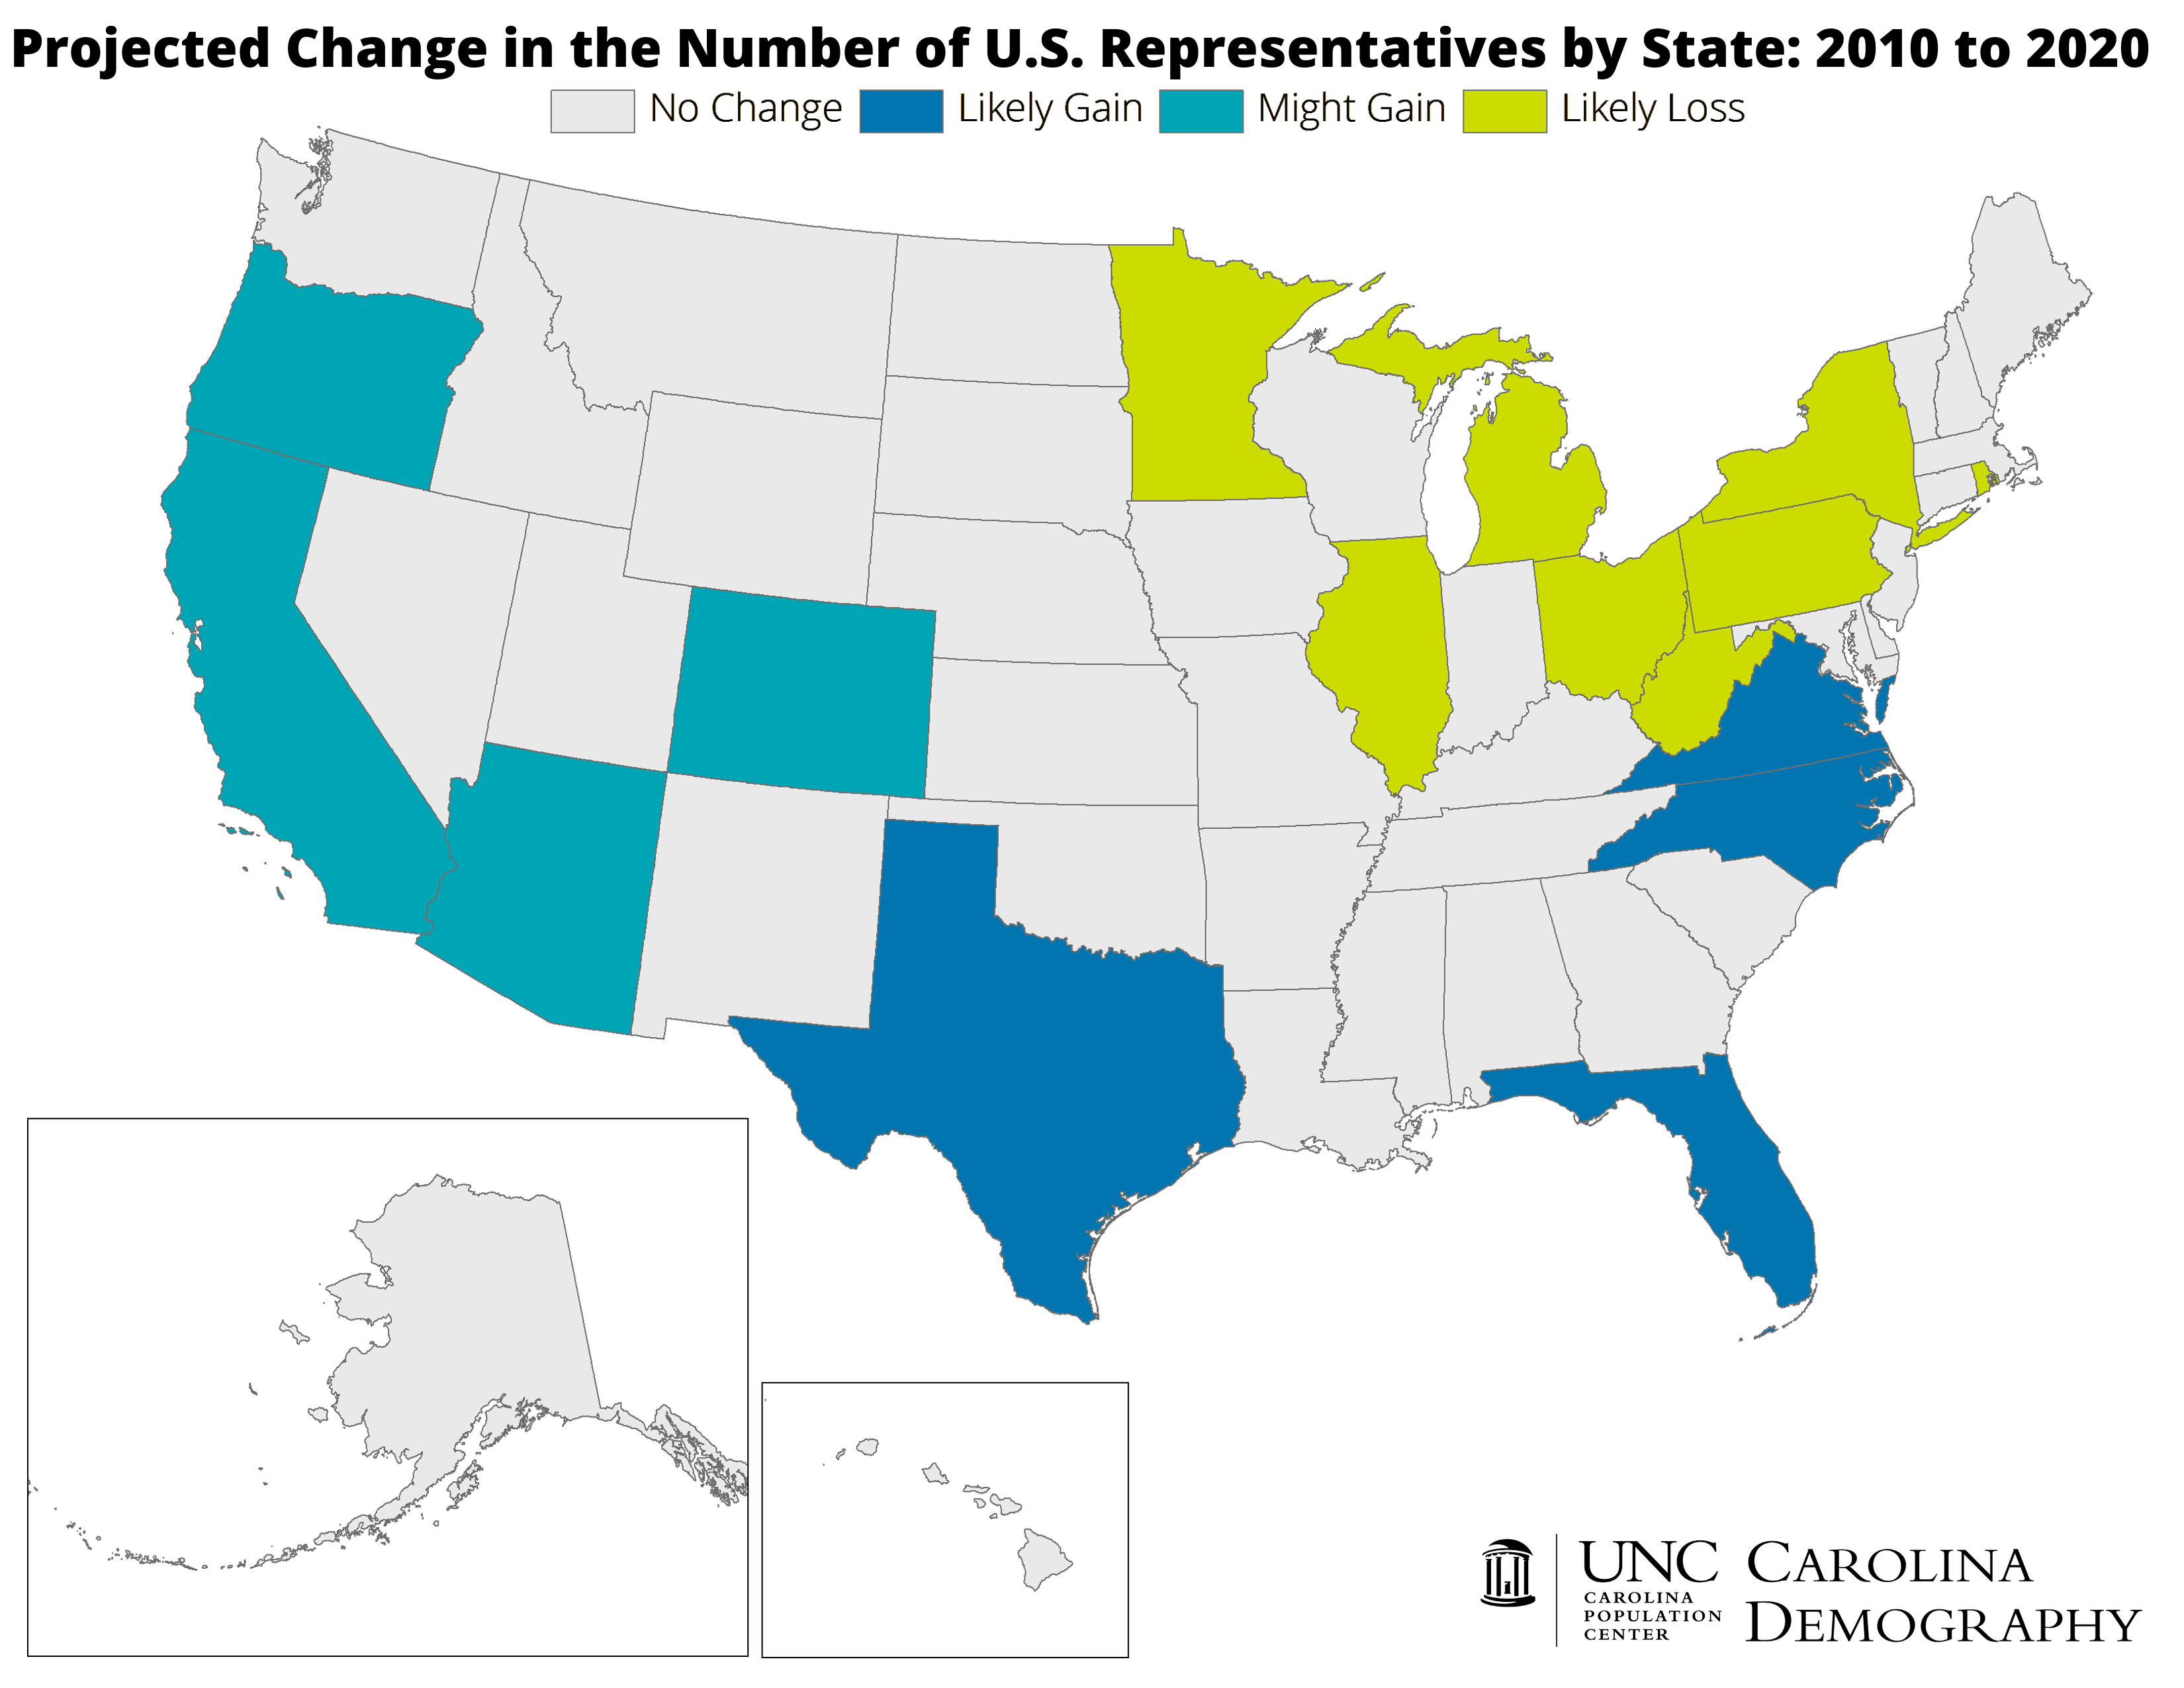
With continued population shifts from the Northeast and Midwest to the South and West, seven states across these two regions are projected to lose a congressional seat in 2020. These include Illinois, Michigan, Minnesota, and Ohio in the Midwest and New York, Pennsylvania, and Rhode Island in the Northeast. West Virginia is the lone Southern state (based on U.S. Census Bureau regional classifications) projected to lose a seat in 2020. Except for Rhode Island, New York, and West Virginia, these losses are predicted in all four of the 2020 projections scenarios considered.
Three states – Alabama (-1), Georgia (+1), and Montana (+1) – are projected to experience changes in 2020 under only one of the four models considered. While shifts are possible, they are unlikely based on this analysis. These three states, and the 31 others not listed on the table, are likely to receive the same number of seats in the U.S. House of Representatives in 2020 that they received in 2010.
Research assistance provided by Caylin Bullock.
Your support is critical to our mission of measuring, understanding, and predicting population change and its impact. Donate to Carolina Demography today.