According to the 2014 Current Population Survey, nearly 70% of North Carolina citizens 18 and older were registered to vote in the November 2014 election. Only about two-thirds of registered voters reported actually voting on Election Day, however, meaning less than half (46.2%) of eligible voters voted in 2014.
Among North Carolina adults, there are significant racial and ethnic differences in eligibility to vote, registration rates, and voter turnout. As a consequence, the composition of the voting population differs from the general population. Using the 2014 Voting and Registration supplement to the Current Population Survey, this post examines differences in eligibility, registration, and turnout across North Carolina’s major racial and ethnic groups.
Where the sample size is sufficiently large, we provide detail for individuals of Hispanic ethnicity (regardless of racial identity) as well as non-Hispanic individuals who identify as white, black, Asian, or other race. The other race category includes American Indian and Alaska Native, Native Hawaiian/Pacific Islander, and individuals who report more than one race. When the underlying sample size is smaller, we either report detail for the two largest racial/ethnic groups (non-Hispanic white and non-Hispanic black) or do not provide racial/ethnic detail.
According to the CPS, nearly all of the state’s white and black adults are eligible to vote (99.5% and 97.9%, respectively) based on citizenship status. Nearly 97% of individuals of other racial groups were eligible to vote. In contrast, only 52.1% of the state’s Asian adults are voting-eligible and only about 34% of the state’s Hispanic adults report being eligible to vote.
Among the voting-eligible population (citizens 18+), registration rates were highest among whites (81.2%). Black residents had the second highest registration rates (78%), followed by other race residents (77.7%). Asian citizens reported the second lowest registration rates (74.3%) and Hispanic residents reported the lowest registration rates (58.9%).
About one-third (34%) of all registered voters completed their voter registration at the Department of Motor Vehicles, although this was more common among white voters (40%) than black (17%). The second most common voter registration location was at a town hall or county/government registration office; just under a quarter (24%) of registered voters reported registering this way. This method was more commonly reported among black registered voters (30%) than white (22%). Registering by mail (11%) and registering at a polling place (10%) were the next most common registration methods among registered voters.
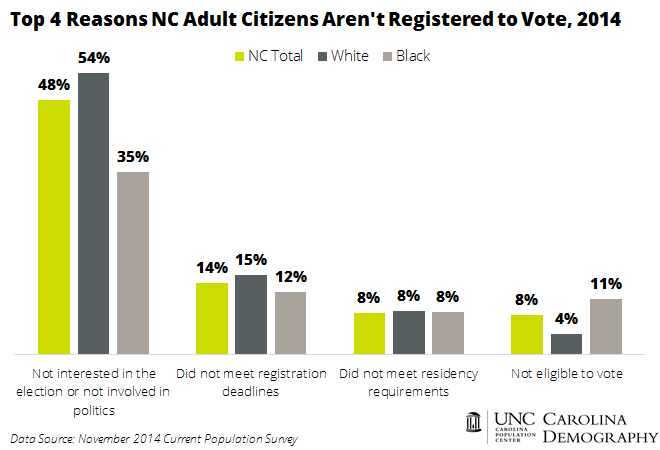
Of the individuals who weren’t registered to vote and gave a reason why, the majority (48%) reported that they were not interested in the election or weren’t involved in politics. This response was more common among white residents (54%) than black residents (35%).
The second most common reason for not registering was that they did not meet voter registration deadlines (14%). This was slightly more common among white residents (15%) than black (12%).
About eight percent of all respondents reported that they did not meet residency requirements or had not lived in the state long enough. White and black residents were equally likely to provide this response.
The fourth most common response was that individuals were not eligible to vote in spite of being a citizen 18 years of age or older. Nearly eight percent (7.5%) of all individuals gave this response for not registering. Black individuals were more likely to give this reason (10.6%) than white (4%). This may reflect the impact of a prior criminal offense or a misunderstanding of eligibility guidelines.
About two-thirds (67%) of all registered voters reported voting in November 2014, representing 46.2% of North Carolina’s voting-eligible population. Black voters reported the highest turnout rates (72.7% or 48% of the state’s voting eligible black population). White voters had turnout rates similar to the state (66.7% of registered voters or 47.2% of the voting eligible population) and other race voters had slightly lower turnout rates (62.1% turnout representing 40% of the voting eligible population).
Hispanic registered voters had the second lowest turnout rates: less than half of Hispanic registered voters reported voting on Election Day (49.8%). As a result, only 26% of North Carolina’s voting eligible Hispanic population participated in the 2014 Election. Turnout among Asian voters was even lower (43.7%), and only 25.9% of the state’s voting eligible Asian population reported voting in 2014.
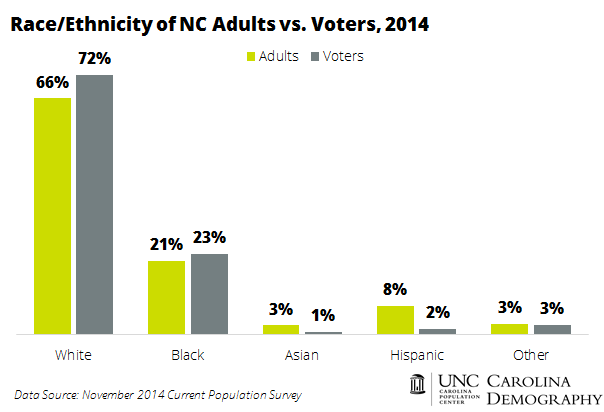
As a result of differences in eligibility, registration, and turnout, North Carolina’s 2014 electorate was significantly whiter than its adult population (72.3% vs. 65.8%). The electorate also had a higher share of blacks than the overall population (22.6% vs. 20.6%). In contrast, Asians comprised a smaller proportion of the electorate than the state’s adult population (0.8% vs. 2.6%). The largest gap was among Hispanics: just over eight percent of North Carolina adults identified as Hispanic in the 2014 CPS. However, fewer than two percent (1.7%) of self-reported voters identified as Hispanic.
Data Note
Current Population Survey data are estimates based on a survey sample conducted in November of 2014. These numbers are different from the actual election numbers reported from the State Board of Elections. The CPS is one of the best sources of data for detailed information about voting and registration. However, like all estimates, it is imperfect, and is prone to overestimating actual turnout rates. According to the United States Election Project, 41.2% of eligible voters (citizens 18+) in North Carolina voted in the 2014 election; in contrast, self-reported estimates from the CPS indicate 46.2% of eligible voters voted in November. This difference is similar to differences at the national level: 36.6% turnout based on US Election Project calculations compared to 41.9% in the CPS.
Your support is critical to our mission of measuring, understanding, and predicting population change and its impact. Donate to Carolina Demography today.