Quite frequently, North Carolina’s trends mirror national averages. Nationwide, 53% of U.S. counties lost population between 2010 and 2014. In North Carolina, 49% did. North Carolina differs slightly from the nation, however, in the county distribution of the underlying demographic processes driving population growth—or decline.
In North Carolina counties it was more common for both demographic processes to move in tandem than it was nationwide. One-third of NC counties had population growth from both natural increase and net in migration compared to 28% of all U.S. counties. At the same time, 27% of NC counties had population losses from both natural decrease and net out migration, slightly more than the 24% of all U.S. counties that had a similar pattern.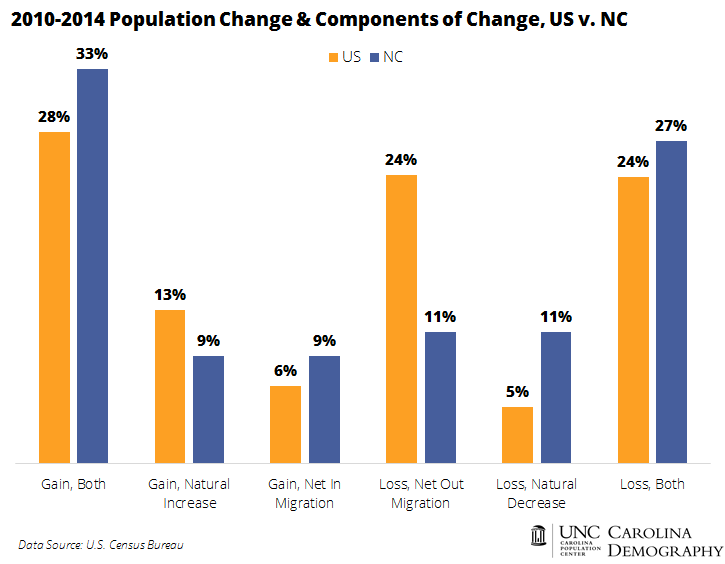
Population loss driven by natural decrease was more common among North Carolina counties than U.S. counties (11% v. 5%), while population loss driven by net out migration was much less common (11% v. 24%). Population growth due solely to net in migration was more common among North Carolina counties (9% v. 6%), while population growth due solely to natural increase was more common nationwide than in the state (9% in NC v. 13%).
Read more:
Your support is critical to our mission of measuring, understanding, and predicting population change and its impact. Donate to Carolina Demography today.