NC in Focus: Black Population
First celebrated on February 12, 1926, Black History Week was established by American historian Carter G. Woodson to celebrate the contributions to our nation made by people of African descent. For many years, this celebration occurred during the second week of February, coinciding with the birthdays of Frederick Douglass and Abraham Lincoln. In 1976, the week was expanded into Black History Month.
2.2 million
The number of black or African-American North Carolina residents on July 1, 2013. This was an increase of 1.3% from July 1, 2012, according to the U.S. Census Bureau’s Population Estimates.
2.7 million
The projected size of North Carolina’s black population on July 1, 2033, according to the North Carolina Office of State Budget and Management. In 2033, the black population is projected to be 22.5% of the state’s total population, a slight increase from the 22% it represented in 2013.
5.2%
The share of the nation’s black population that lived in North Carolina in 2013. Only five states have more black or African-American residents than North Carolina: New York (3.4 million), Texas (3.3 million), Florida (3.3 million), Georgia (3.1 million), and California (2.5 million).
32
The size of the black population in Graham County on July 1, 2013, the smallest in the state. Graham also had the smallest proportion black (0.4%) of any county. Only one other county – Mitchell County – had fewer than 100 black residents in 2013.
318,000
The size of the black population in Mecklenburg County on July 1, 2013, the largest in the state and representing 32% of all Mecklenburg residents. Four other counties have black populations of 100,000 or more: Wake (209,000); Guilford (171,000); Cumberland (122,000); and Durham (111,000).
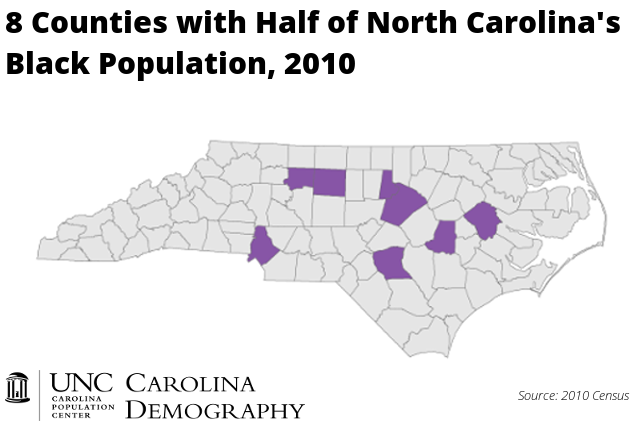
North Carolina’s black population is highly concentrated in urban areas. Half of the state’s black population can be found in 8 counties.
7
The number of counties that are majority black. Bertie County had the highest population proportion black or African American in 2013, 61.6%. Hertford (59.7%), Northampton (58.4%), Edgecombe (57.7%), Halifax (53.1%), Warren (51.7%), and Vance (50.7%) are the other six counties where the majority of the population is black or African American.
3.2%
The share of the state’s black population that identified as Hispanic in 2013.
116,000
The number of individuals who were black or African American in combination with one or more other races on July 1, 2013. According to the 2010 Census, the most common combination was black and white, followed by black and American Indian/Alaska Native, and black in combination with white and American Indian/Alaska Native.
Data Source: Unless otherwise specified, all data came from the U.S. Census Bureau’s Population Estimates.
Your support is critical to our mission of measuring, understanding, and predicting population change and its impact. Donate to Carolina Demography today.