The National Science Board (NSB) recently released an interactive, online resource with data and graphics about student proficiency, college degrees in science, technology, engineering and mathematics (STEM) fields, and jobs in science-related occupations.
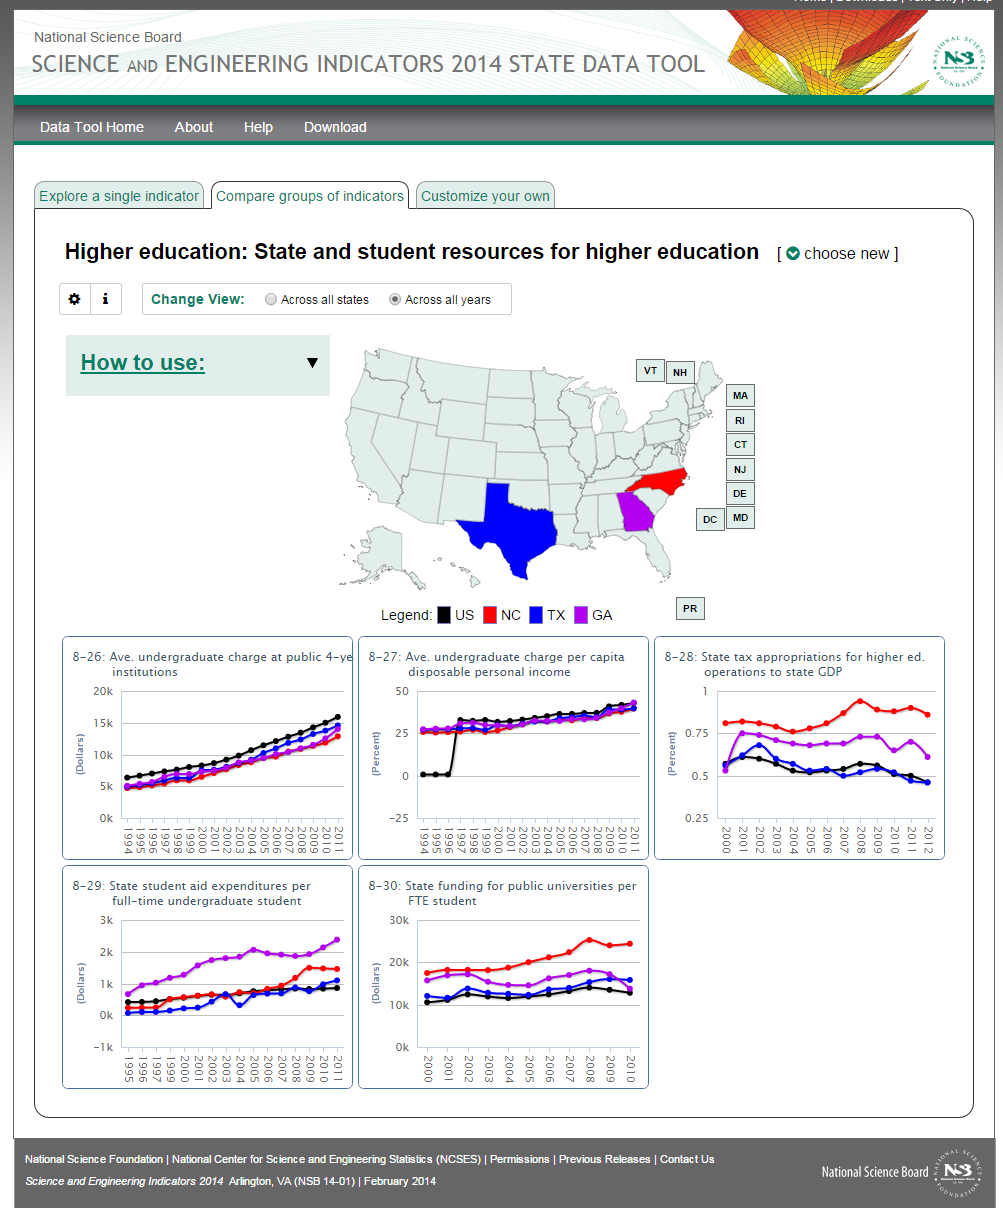
While examining this data, I stumbled across a second web resource related to the NSB’s Science and Engineering Indicators 2014. The S&E Indicators State Data Tool provides data on 59 state indicators, such as elementary and secondary education metrics, the size of the STEM labor force, and R&D investments. You can compare states or examine changes over time with preset groups of indicators or customized indicator groupings.
I found comparing states across years to be the most useful for understanding state-to-state and regional variation in key indicators. It also highlighted how states may diverge or converge with national trends over time. Additionally, the quartile map made it easy to quickly visualize state-to-state differences and regional clustering on one variable.
What indicators do you find most promising—or troubling?
Your support is critical to our mission of measuring, understanding, and predicting population change and its impact. Donate to Carolina Demography today.