NC in Focus: Explore 2011-2013 ACS Data
The Census Bureau released the 2011-2013 American Community Survey (ACS) estimates today. These estimates cover detailed socioeconomic characteristics of the population and are available for all counties with populations of 20,000. This release provides data on 84 counties in North Carolina. The final 2013 ACS release—the 2009-2013 data—covering all areas, including the census tract and block group levels, is scheduled for December 4.
With the release of this data set, users can compare the time period during and immediately after the onset of the Great Recession (2008-2010) with later years (2011-2013). The Census Bureau’s American FactFinder tool has built in “comparative” tables that allow you to easily see whether the changes over the two time periods are statistically significant.
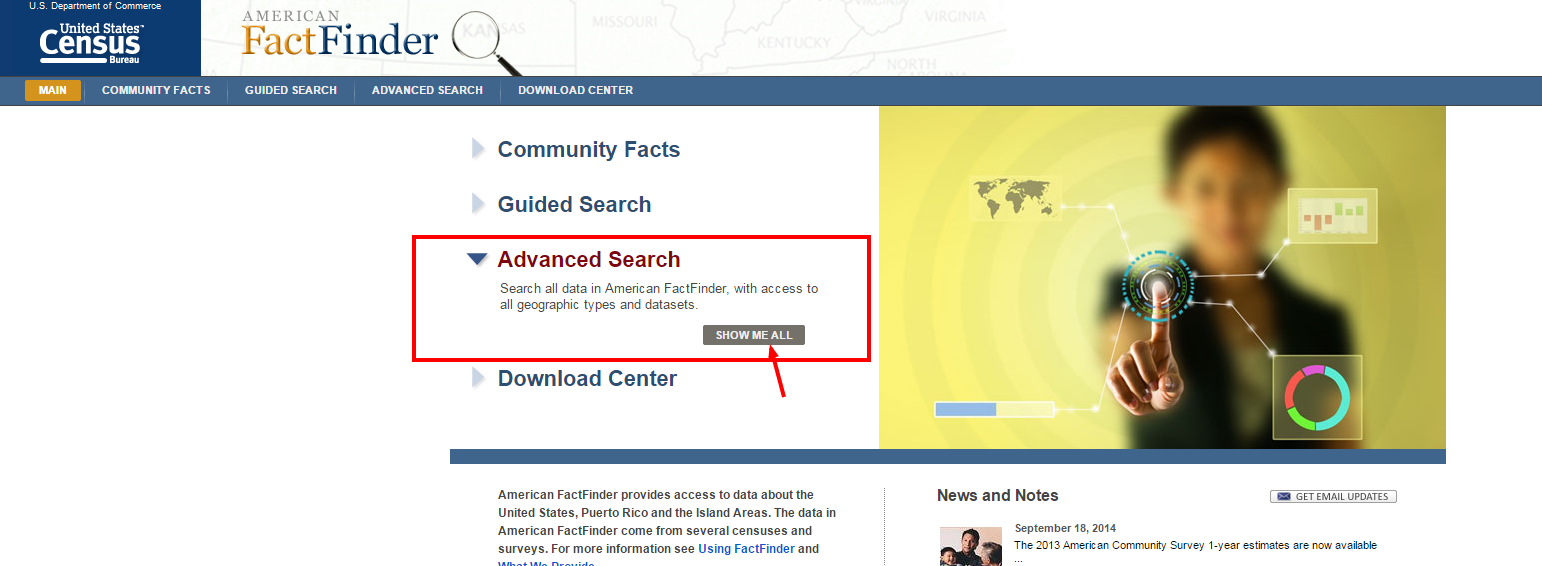
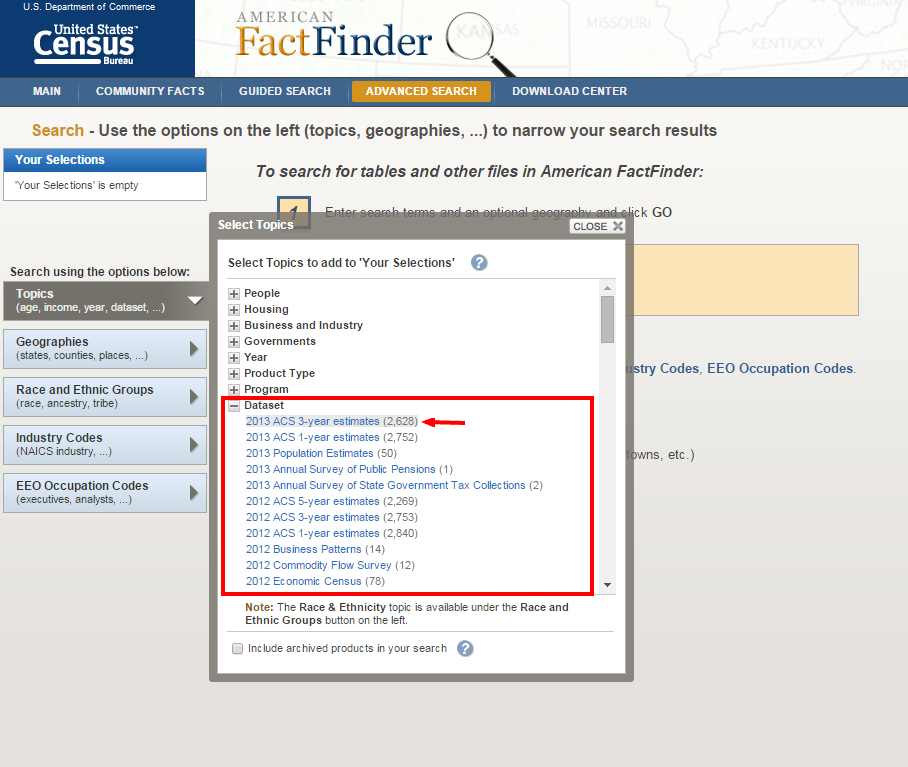
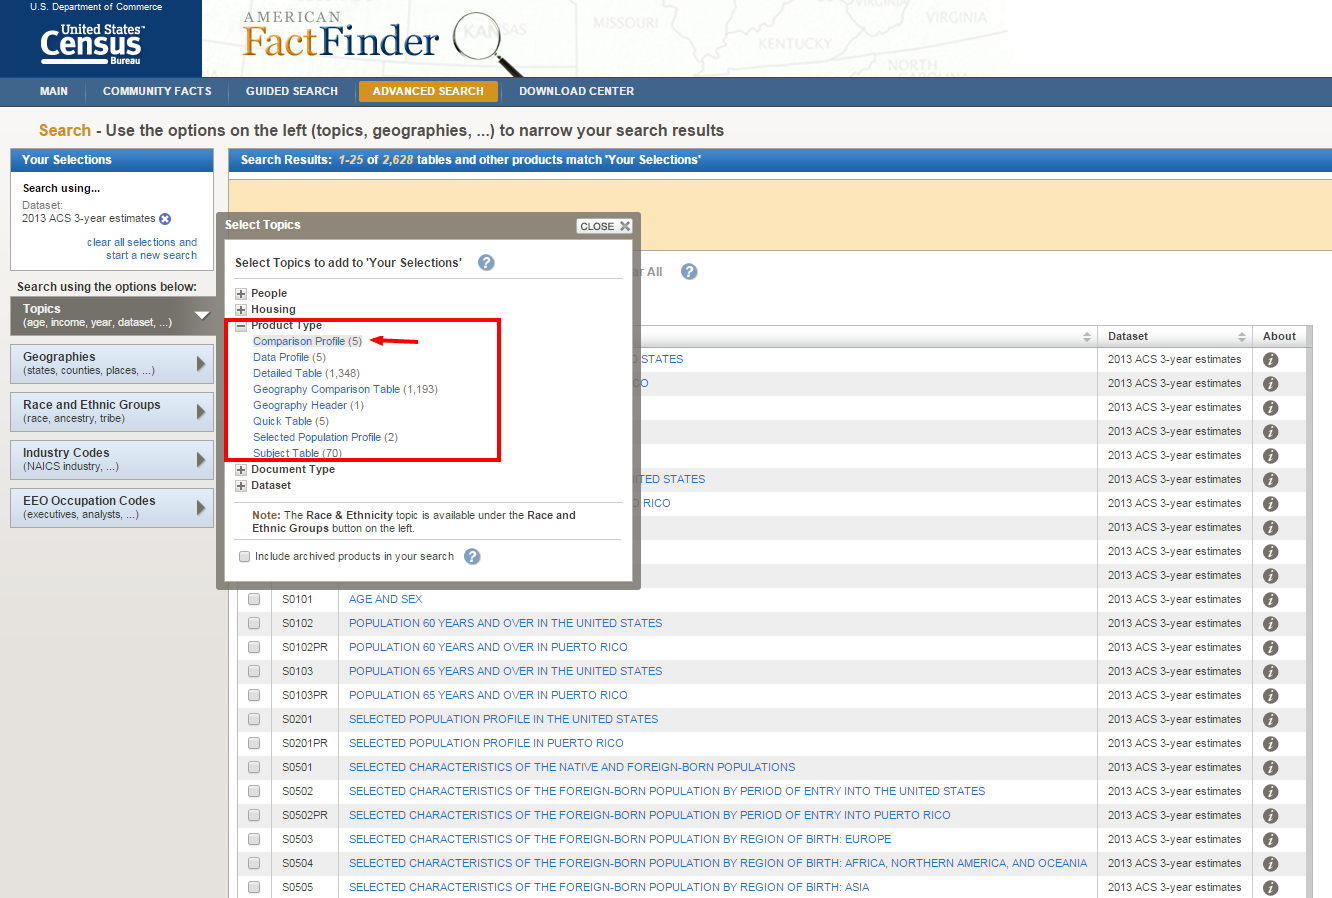
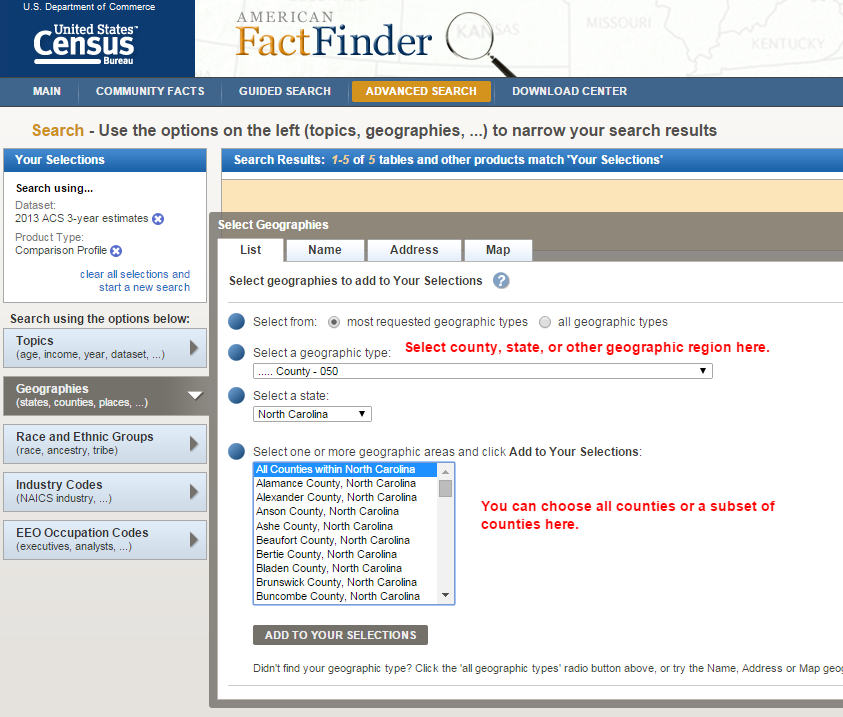
Here’s how to start exploring:
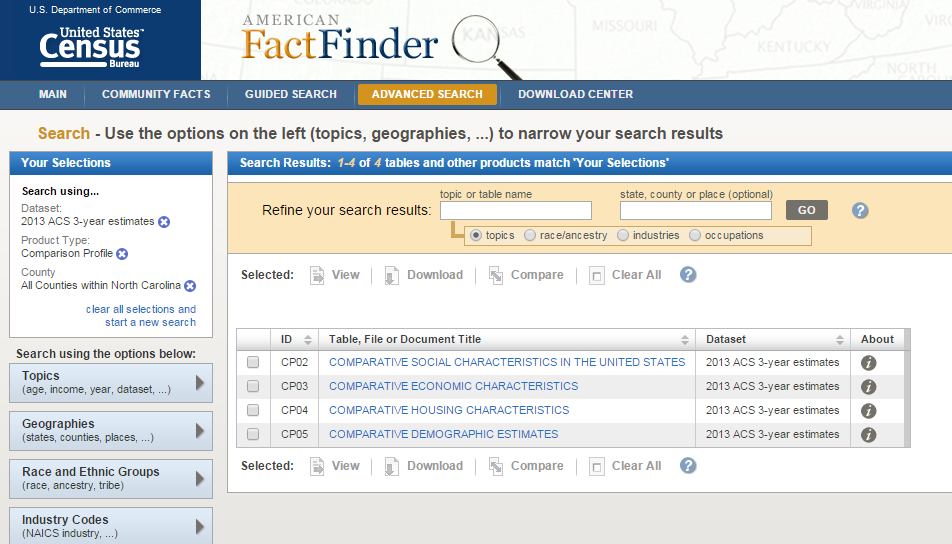 Once you open one of the comparative tables, you will see 3 columns under each geography type: the most recent 2011-2013 ACS estimate, the 2008-2010 estimate, and the results from a test of statistical significance. An asterisk (*) in the statistical significance column indicates that the 2011-2013 estimate is significantly different (90% confidence interval) from the 2008-2010 estimate.Below, the snippet of the “Comparative Economic Characteristics” table shows that Alamance County’s population age 16 and over has grown significantly since 2008-2010 and that the 2011-2013 labor force participation rates and unemployment rates are significantly different than they were in 2008-2010.
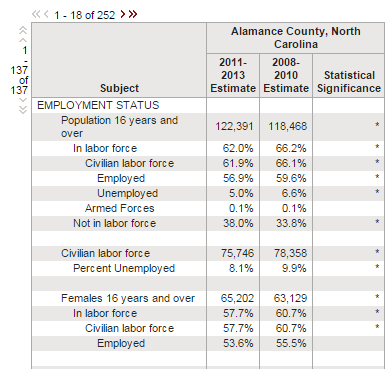
What will you find in the data? Happy exploring!
Your support is critical to our mission of measuring, understanding, and predicting population change and its impact. Donate to Carolina Demography today.