North Carolina Hispanics and the Electorate
Monday, September 15th, through Wednesday, October 15th, marks National Hispanic Heritage Month.
In 2012, the Pew Research Hispanic Trends Project published a look at the Hispanic electorate in every state. They noted that, in North Carolina:
The number of Latinos registered to vote has increased tenfold since 2004. It rose from 10,000 during the 2004 presidential election to 68,000 during the 2008 presidential election and now stands at 113,000. The share of Latino registered voters in North Carolina has also risen since 2004, from 0.2% in 2004 to 1.7% today….
Both the size of North Carolina’s Hispanic eligible voter population (U.S. citizens ages 18 and older) and the number of Hispanic registered voters in the state have increased in the two years since the Pew study was released. In 2010 (the latest year for which data was available for the Pew study), 196,000 Hispanics were eligible to vote. Two years later, 214,000 eligible voters in the state were Hispanic, an increase of 18,000 or 9.2% between 2010 and 2012.
Similar increases were seen in the number of Hispanic registered voters. According to the North Carolina State Board of Elections, there were 113,000 Hispanics registered to vote prior to the presidential election in 2012. As of October 4, 2014, statistics show 125,186 Hispanics are currently registered to vote in the state, an increase of 12,000 or 10.6%.
At present, only one in four North Carolina Hispanics is eligible to vote, due to either age or citizenship. But North Carolina (and the nation as a whole), is about to experience a rapid rise in the size of the Hispanic electorate. This is mainly because the Hispanic population is so young and the majority of young Hispanics are U.S. citizens. As they age, they will automatically expand the Hispanic voting eligible population.
The graph below shows the North Carolina Hispanic population by age and citizenship status based on data from the 2012 American Community Survey. The purple bars represent Hispanic individuals currently of voting age (18+); the dark shading represents citizens (voting eligible) while the light purple represents non-citizens. The green bars represent Hispanics who are under 18. Similarly, the dark green represents citizens (future voting eligible) and the light green represents non-citizens.
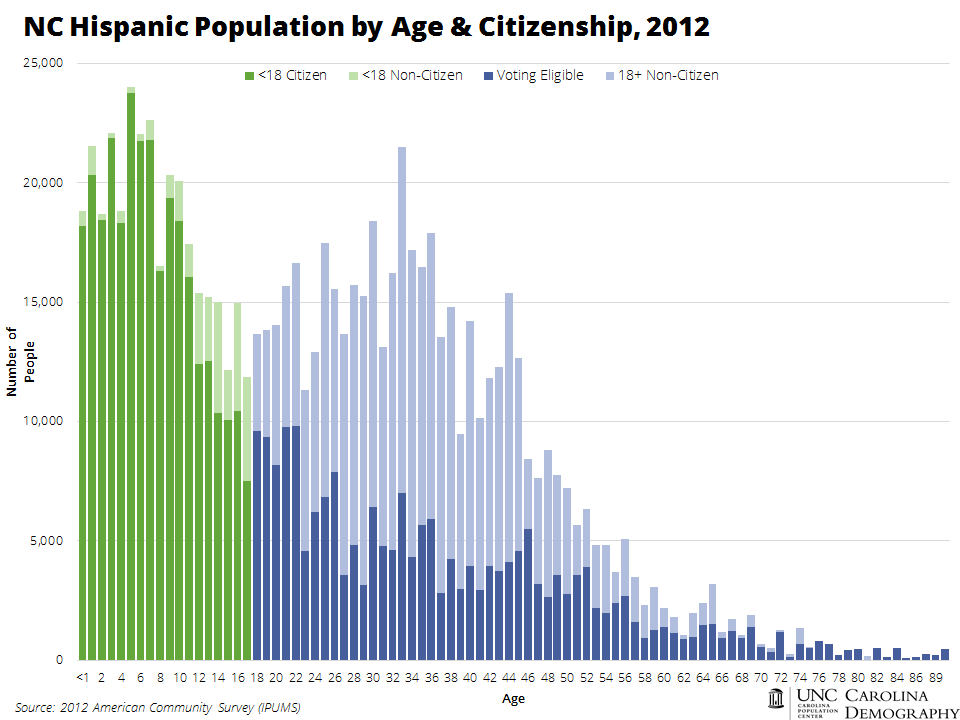
As of 2012, only 214,000 of the state’s 518,000 Hispanics age 18 and older were eligible to vote (41%).
In contrast, 72% the Hispanics who will turn 18 between 2012 and 2015 are citizens, 84% of Hispanics who will turn 18 between 2015 and 2020 are citizens, and 97-98% of Hispanics who will turn 18 between 2020 and 2030 are citizens. Statewide, the size of the voting eligible Hispanic population should surpass 300,000 by 2020, 400,000 by 2025, and be close to or above 500,000 by 2030.
All data used in this analysis were retrieved from the 2012 American Community Survey using IPUMS-USA.
Your support is critical to our mission of measuring, understanding, and predicting population change and its impact. Donate to Carolina Demography today.