North Carolina’s Hispanic Population
Monday, September 15th, through Wednesday, October 15th, marks National Hispanic Heritage Month.
In 1990, 76,726 North Carolina residents identified as Hispanic, 1.2% of the state’s population. Twenty-two years later, the state’s Hispanic population had increased eleven-fold. According to the American Community Survey, there were 845,420 Hispanic individuals living in North Carolina in 2012, representing 8.7% of the state’s population.
Both components of population growth—net migration and natural increase, or more births than deaths—drove the rapid growth of North Carolina’s Hispanic population. Between 1990 and 2000, the state’s Hispanic population grew by 302,237 individuals, a growth rate of nearly 400%. The vast majority of this growth—88%—was from net in-migration of Hispanic individuals from other states or countries. More than a quarter of a million Hispanics moved to North Carolina during the 1990s.
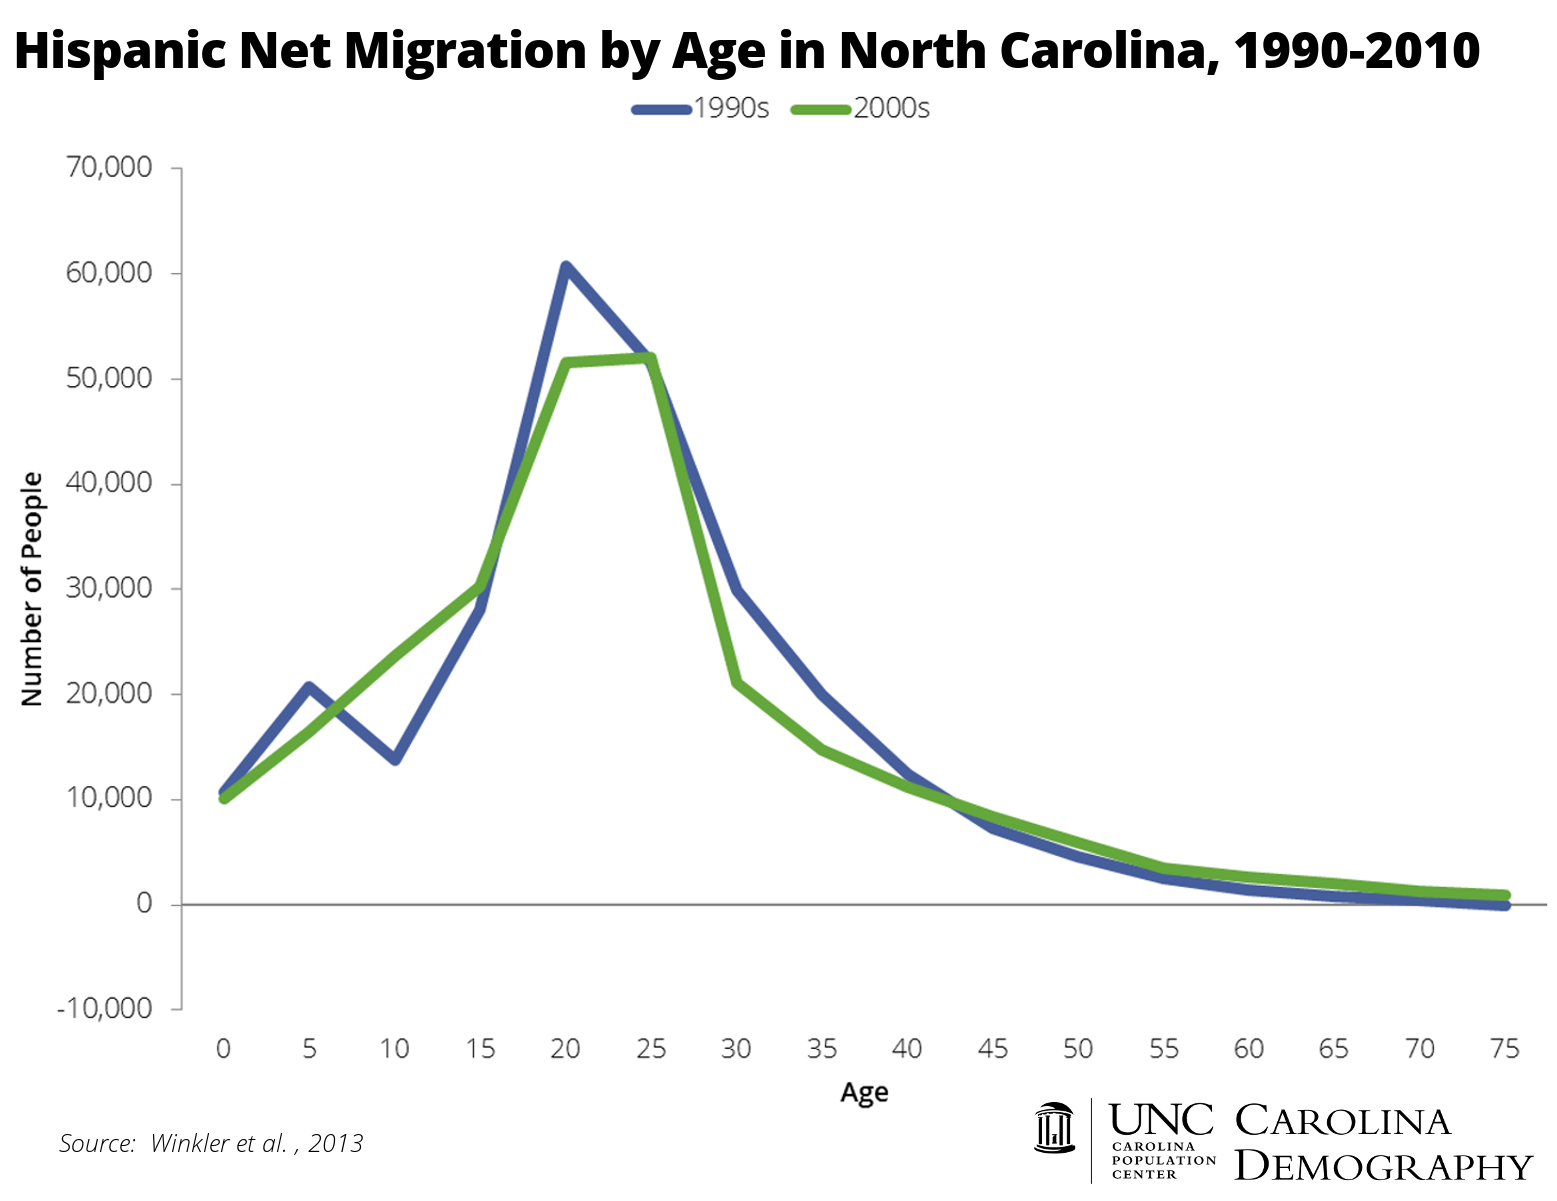
The graph below displays Hispanic net migration by age in North Carolina between 1990 and 2000 and 2000 and 2010. During both decades, migration peaked among young individuals likely moving to the state to seek employment. The volume of net in-migration declined substantially after age 35.
The state’s Hispanic population grew by another 421,157 individuals between 2000 and 2010, an increase of 111%. Driven by the large influx of individuals in prime childbearing years (ages 15-35) during the ‘90s, the components of population growth in the 2000s were more evenly divided between net migration and natural increase. Sixty-one percent of growth over the most recent decade was due to net in-migration, with 256,000 individuals moving into the state. The other 39% was due to more births than deaths.
The Hispanic population growth since 1990 has been due to in-migration of individuals heavily concentrated between the ages of 15 and 29 and births. As a consequence, North Carolina’s Hispanic population is very young. In 2012, the median age in North Carolina was 37.8. Among North Carolina’s Hispanics, the median age was 24.7, meaning half of the state’s Hispanic population was younger than 24.7.
The figures below show the North Carolina population by age, sex, and Hispanic origin. Age is presented in five-year intervals with the male population on the left side of the chart and the female population on the right side. Each bar represents the total size of the population for the given age and sex group. The first figure (in blue) presents data for North Carolina’s non-Hispanic population. There were more than 651,000 individuals ages 50-54 in 2012, the largest age group among the state’s non-Hispanic residents.
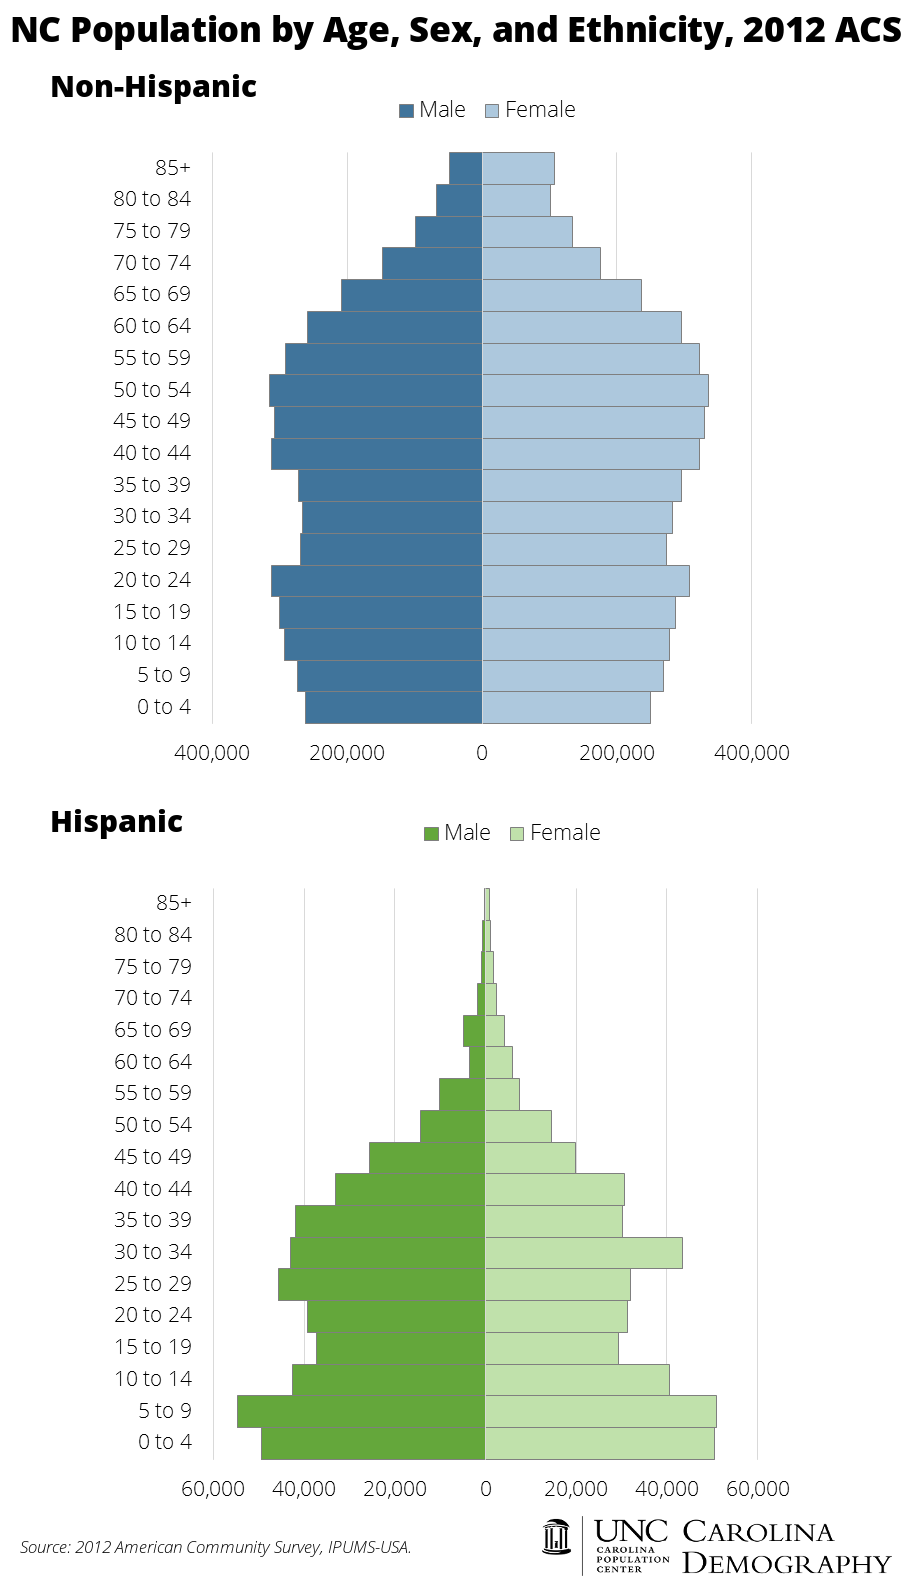
The second figure (in green) presents data for North Carolina’s Hispanic population. The age structure of the Hispanic population is a classic population pyramid: large population sizes at younger ages taper to very small population sizes at older ages. Unlike the state’s non-Hispanic population, children ages 5-9 comprised the largest age group among the Hispanic population (nearly 106,000). Children ages 0 to 4 were the second largest Hispanic age group, with 99,920 individuals. Together, nearly 1 of every 4 Hispanic residents in North Carolina was under the age of 10 in 2012. In contrast, fewer than 75,000 Hispanic residents were age 50 or older.
This age structure has implications for future population growth. The Great Recession put a damper on migration—particularly international migration. But, the age structure of North Carolina’s Hispanic population means that there will be many more births than deaths, and North Carolina’s Hispanic population would continue to grow even in the absence of migration. Moreover, the Hispanic population will continue even if fertility rates among Hispanics declined significantly (a fact of population momentum).
And while the state’s Hispanic population would continue to grow even if net migration declined to zero, net in-migration has not stopped. Recent American Community Survey data show that net migration has slowed but that North Carolina’s Hispanic population continues to grow each year from migration. Given the combined impacts of net migration and natural increase, it is likely that the state’s Hispanic population will increase beyond 1 million by 2020.
Your support is critical to our mission of measuring, understanding, and predicting population change and its impact. Donate to Carolina Demography today.