Donuts, Old and New: A Look at Charlotte
In the mid- to late-twentieth century, suburbanization shifted population growth from urban areas to suburbs. In response, revitalization of the downtown core became the primary focus of many cities’ economic development plans. This is what Aaron Renn of the Urbanophile terms the “Old Donut” model: cities across the nation spent the past few decades trying to fill their downtown economic “holes” through billions of dollars in revitalization efforts, “ranging from stadiums to convention centers to hotels to parking garages to streetcars to museums and more.”
And, in many cases, it worked. “Cities are back,” note Richard Voith and Susan Wachter from the Penn Institute for Urban Research, and recent city growth has been fueled by the in-migration of young, well-educated professionals and affluent retirees.
Cities aren’t the only portions of metro areas that are booming: much of the nation’s metropolitan growth has been in further-flung outer suburbs. At the same time, the inner suburbs and non-downtown urban core are stagnating. This creates what Renn terms “The New Donut,” a vibrant core with a belt of economically struggling inner suburbs surrounded by more affluent and growing exurbs.
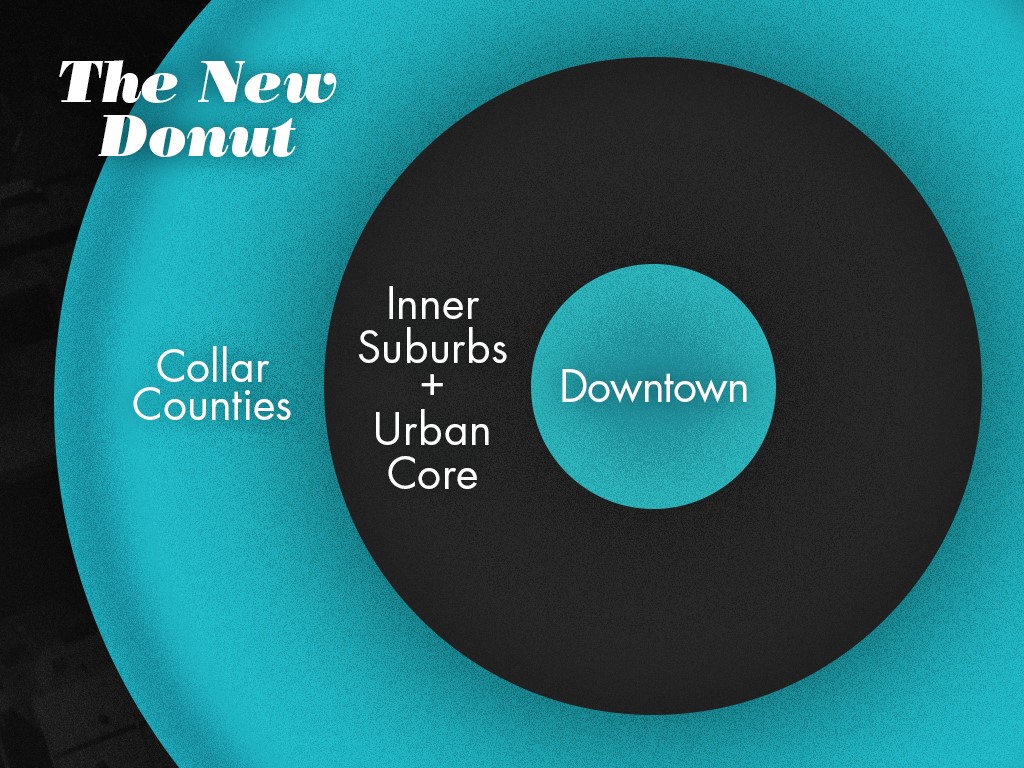
What are some of the factors driving this shift? And what does the shift from the “Old Donut” to “New Donut” model of the city look like with respect to the underlying population? Luke Juday of the Demographics Research Group at the University of Virginia’s Weldon Cooper Center for Public Service elaborated on some of the factors driving this “New Donut” model of the city:
But in between [downtown and the collar counties] there is a belt of stagnant urban areas and inner-ring suburbs. The upper-middle class residents who drove development in these areas have since retired or moved on to bigger and better homes farther away. The homes they’ve left are smaller than those preferred by upper-middle class buyers today and lack the amenities (or panache) of historic urban areas. Infrastructure is on its second or third life cycle and its age is starting to show. The original residents are increasingly being replaced by lower-income residents moving out of the inner city. Some are probably driven by rising rents in the newly revitalized core. Others may be taking advantage of the shift from public housing to Section 8 vouchers. Some are simply moving to the suburbs for the same reason the original residents did years ago as the bottom income bracket in the US is now high enough to make car ownership a possibility and give inner-city families a way out of failing school systems.
Looking at the Charlotte metropolitan area, Luke used block group data from the 1990 Census and the 2008-2012 American Community Survey to examine a variety of indicators—share of the population with a bachelor’s degree or higher, per capita income, and poverty rate—to illustrate the shift from the “Old Donut” cities to the “New Donut.” The graph below shows the share of the Charlotte population age 25 and older with a bachelor’s or more by distance from the city center.
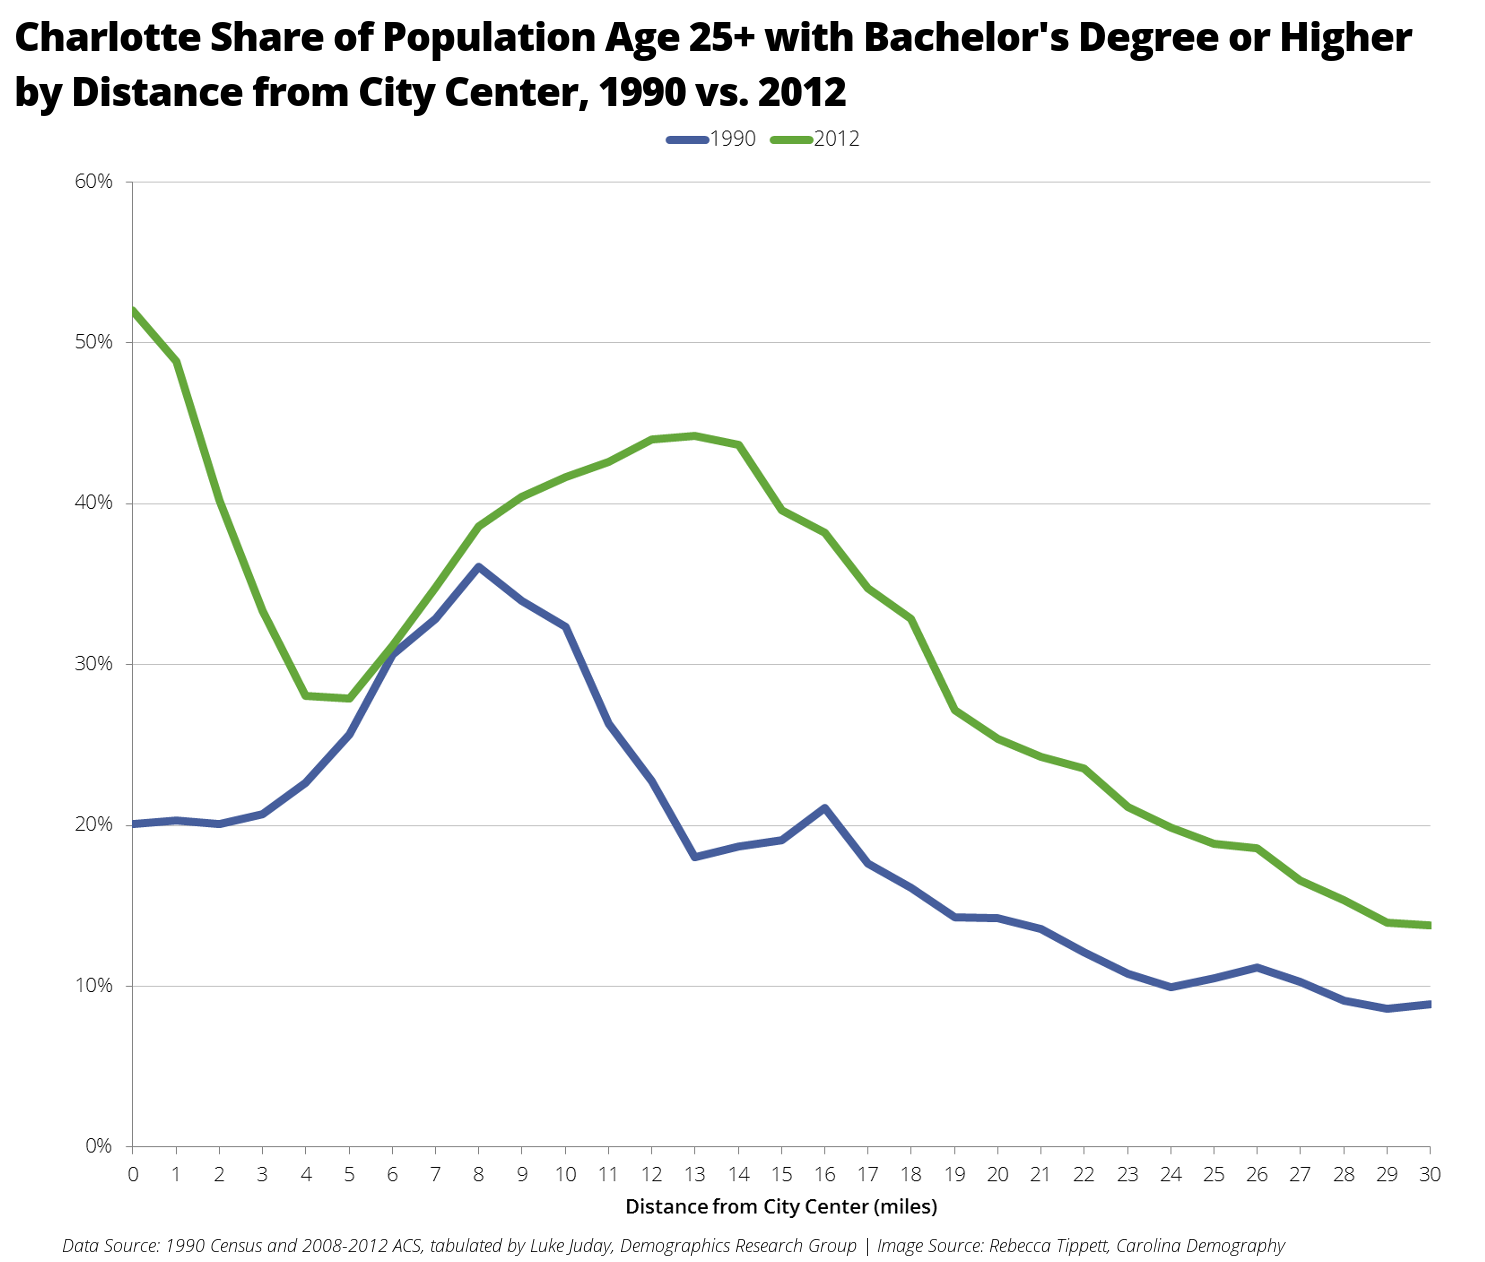
Luke notes there is a “clear “hump” pattern” in 1990. The center of the city had relatively low rates of educational attainment, with about 20% of residents holding a bachelor’s degree or more. Educational attainment was much higher in the suburbs—roughly a third of adults living between 5 and 10 miles outside of the city center had a bachelor’s degree—and then declined in the rural areas further outside the urban core.
Charlotte has grown significantly since 1990, as has the share of U.S. adults with a bachelor’s degree, but Luke’s data highlight a new change in Charlotte over the past two decades: “the hump has been replaced by an “S-curve.”” Consistent with broader patterns of urbanization and gentrification, the new residents of Charlotte’s downtown are highly educated: nearly half of adults within a 2-mile radius of downtown Charlotte have a bachelor’s degree or more. These rates plummet between 3 and 5 miles away from the core before rising again. But the suburban hump in 2012 is both further away and spread over a greater distance, starting about 8 miles from the city center and continuing for 7 miles more (to mile 15), until declining once more.
For more analysis, including additional graphs of Charlotte and other cities, please visit Luke’s original post.
Your support is critical to our mission of measuring, understanding, and predicting population change and its impact. Donate to Carolina Demography today.