NC in Focus: Labor Day
In celebration of Labor Day, a national holiday created to recognize the social and economic achievements of American workers, here’s a quick look at some data about North Carolina’s labor force.
4.7 million North Carolinians 16 and over were in the civilian labor force in 2013.
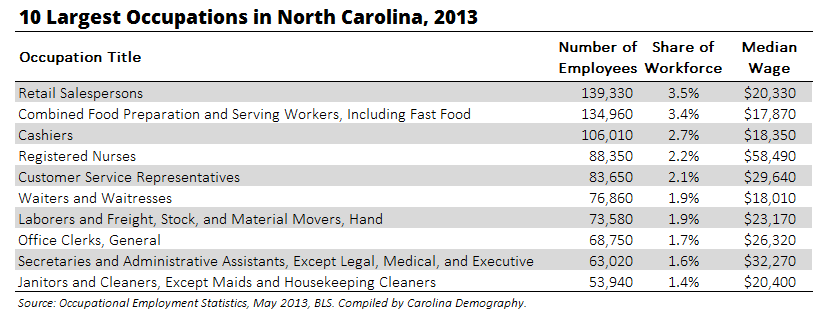
Among wage and salary employees working in non-farm establishments, nearly a quarter (22.5%) were employed in one of these 10 occupations in 2013:
117,000 North Carolina employees were members of a union in 2013 and another 184,000 were represented by unions. Together, this represents 301,000 employees or 7.8% of all wage and salary employees in non-farm establishments who are represented by a union. Arkansas has the lowest rate of employees represented by a union (7.6%); New York has the highest rate (50%).
Among North Carolina’s 3.1 million full-time, civilian workers between the ages of 18 and 64 in 2013:
Have questions not answered here? Tweet @ncdemography with what you want to know!
The civilian labor force excludes individuals employed in the Armed Forces. Data on employer-sponsored health insurance and pension participation are from the 2013 March Current Population Survey and were retrieved from IPUMS-CPS. All other data used in this post were retrieved from the Bureau of Labor Statistics.
Your support is critical to our mission of measuring, understanding, and predicting population change and its impact. Donate to Carolina Demography today.