Researchers at UNC’s Center for Urban and Regional Studies identified 162 economically distressed tracts in North Carolina based on the 2007-2011 American Community Survey. Each distressed tract met three criteria:
Statewide, these 162 tracts represent 7.4% of North Carolina’s 2,195 census tracts. An additional 477 census tracts were not distressed but bordered on a tract that was classified as distressed. The remaining 1,556 North Carolina census tracts were neither distressed nor geographically adjacent to a distressed tract.
Nearly 580,000, or 6%, of the state’s residents live in a distressed tract and 2.1 million (22%) live in a census tract adjacent to a distressed tract.
While census tracts correspond—roughly—to the notion of a neighborhood or community, they are statistical boundaries, representing a geographic space that contains a number of people for whom relevant social, demographic, and economic characteristics/statistics can be reliably calculated by the U.S. Census Bureau. Neighborhood boundaries—and community characteristics—do not hew to these arbitrary boundaries. The characteristics of census tracts adjacent to distressed tracts illuminate that poverty does not stop and start at their borders.
Non-distressed tracts that border a distressed tract are doing better than their highly distressed neighbors but remain below the statewide average on all three indicators. Compared to tracts that were neither distressed nor adjacent to a distressed tract, tracts with at least one distressed neighbor had higher poverty rates (20% vs. 13%), higher unemployment rates (10.9% vs. 8.5%), and lower per capita income ($21,521 vs. $27,548).
The UNC CURS study revealed key differences in demographic, social, and economic characteristics of distressed and non-distressed census tracts, with specific attention given to urban and rural comparisons. The nature of census tracts, however, and their changing boundaries over time, posed challenges to comparing how these tracts changed over time. Using the Carolina Demography methodology developed to bridge (or normalize) selected elements of the 2000 Census data into 2010 census tract boundaries and additional data on economic characteristics from Brown University’s Longitudinal Tract Database (LTDB), I compared economic characteristics for these tracts between 2000 and the 2007-2011 ACS and overall population change between 2000 and 2010. A few key findings emerge:
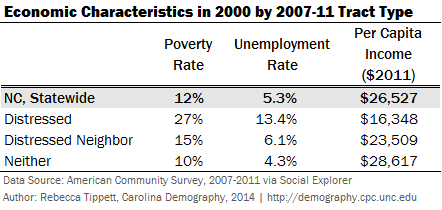
Neighborhood economic characteristics are, in general, stable over time. This is especially true for short time periods such as a decade. Well-to-do neighborhoods with low unemployment rates, low poverty, and high per capita incomes tend to stay well-to-do, and areas with concentrated poverty and high unemployment tend to stay economically distressed or near the margins of distress.
In 2000, the overall economy was doing better than it is today, but the relative position of economically distressed tracts—and their neighbors—was similar: they had markedly higher poverty, higher unemployment, and lower per capita income compared to statewide averages.
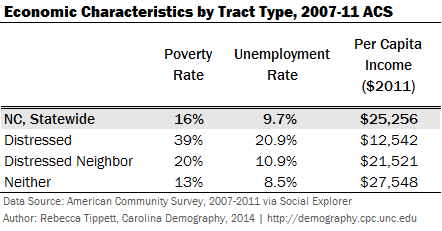
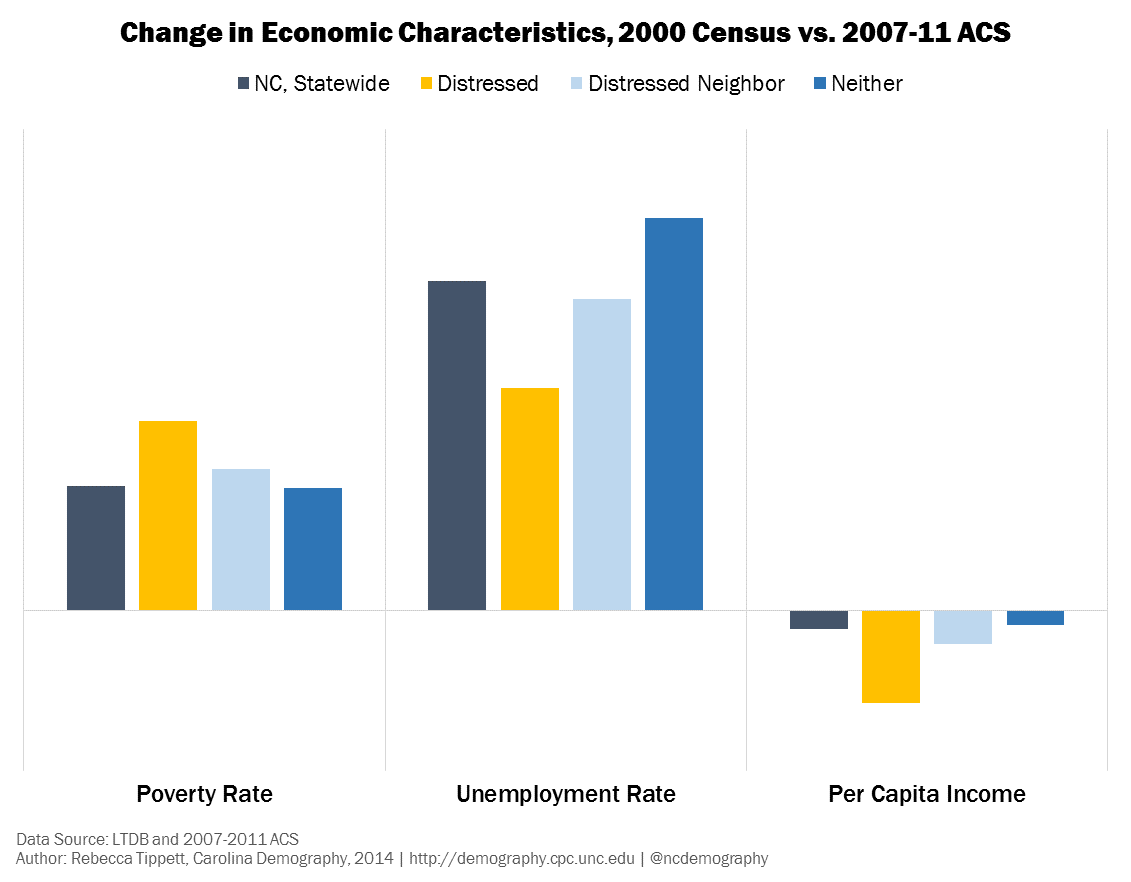
Due to the Great Recession, North Carolina’s economic condition (like the nation’s) worsened on all three indicators between 2000 and the five years covered in the 2007-2011 American Community Survey. Over this time period, North Carolina’s poverty rate increased 31%, from 12% to 16%; unemployment nearly doubled, rising from 5.3% to 9.7%; and per capita income decreased by 5% or nearly $1,300 per person.
In general, the impacts of the economic downturn were even more pronounced in distressed tracts. Among these 162 tracts, post-recession poverty rates were 47% higher than they were in 2000, with nearly 4 of every 10 residents living below the poverty line. One-fifth of residents were unemployed in the 2007-11 ACS, and per capita personal income was reduced by more than $3,800 or nearly a quarter (-23%) of 2000 values, likely reflecting this lack of work.
North Carolina grew by 18.5% between 2000 and 2010, gaining nearly 1.5 million new residents. Non-distressed tracts with no distressed neighbors grew by 23% and accounted for the majority of this growth—1.28 million or 86% of the state’s population growth occurred in these tracts. Non-distressed tracts that had at least one distressed neighbor grew, but at a slower pace, increasing by 12% or 225,000 over the decade.Over this same time period, distressed tracts, as a whole, lost nearly 15,000 persons, a decline of 2.5% over the decade. These patterns mirror broader, national patterns of population loss in chronically high poverty tracts and suggest that individuals who are able to move away from pockets of entrenched poverty and unemployment do so. Because individuals who can and do move may have different characteristics than those who cannot—higher income and education, for example—these population dynamics may exacerbate the economic distress of already distressed tracts.
Your support is critical to our mission of measuring, understanding, and predicting population change and its impact. Donate to Carolina Demography today.