North Carolina, Migrant Magnet
North Carolina is an attractive state for individuals of all ages. Our state’s colleges and universities and military bases draw young adults. Job opportunities in both lower-skill and high-tech industries bring more individuals to the state. And, when individuals are done working, they are increasingly choosing North Carolina as a place to retire. These factors, combined with the nationwide increase in international migration from 1990-2010, pulled many individuals to the state. Today, nearly half of all North Carolina adults (18+) were born outside of the state.
The graph below shows the proportion of North Carolina’s adult residents who were born outside the state for each decennial census from 1850 through 2010. Until 1930, fewer than 10% of the North Carolina’s adult residents were born outside of the state. This proportion increased steadily through 1950 and then rose more rapidly. By 1980, more than a quarter of the state’s adult population was not native to North Carolina.
Migration drove North Carolina’s rapid growth over the past two decades. The impact of these migrants on population can be seen in the steep slope of the line between 1980 and 2010. Since 1980, the proportion of non-native North Carolinians nearly doubled. Though migration has slowed since the 2007 recession, it is still the main driver of state population growth and the proportion of non-native North Carolinians continues to grow. More than 48% of North Carolina adult residents were born outside of the state according to the 2012 American Community Survey (ACS).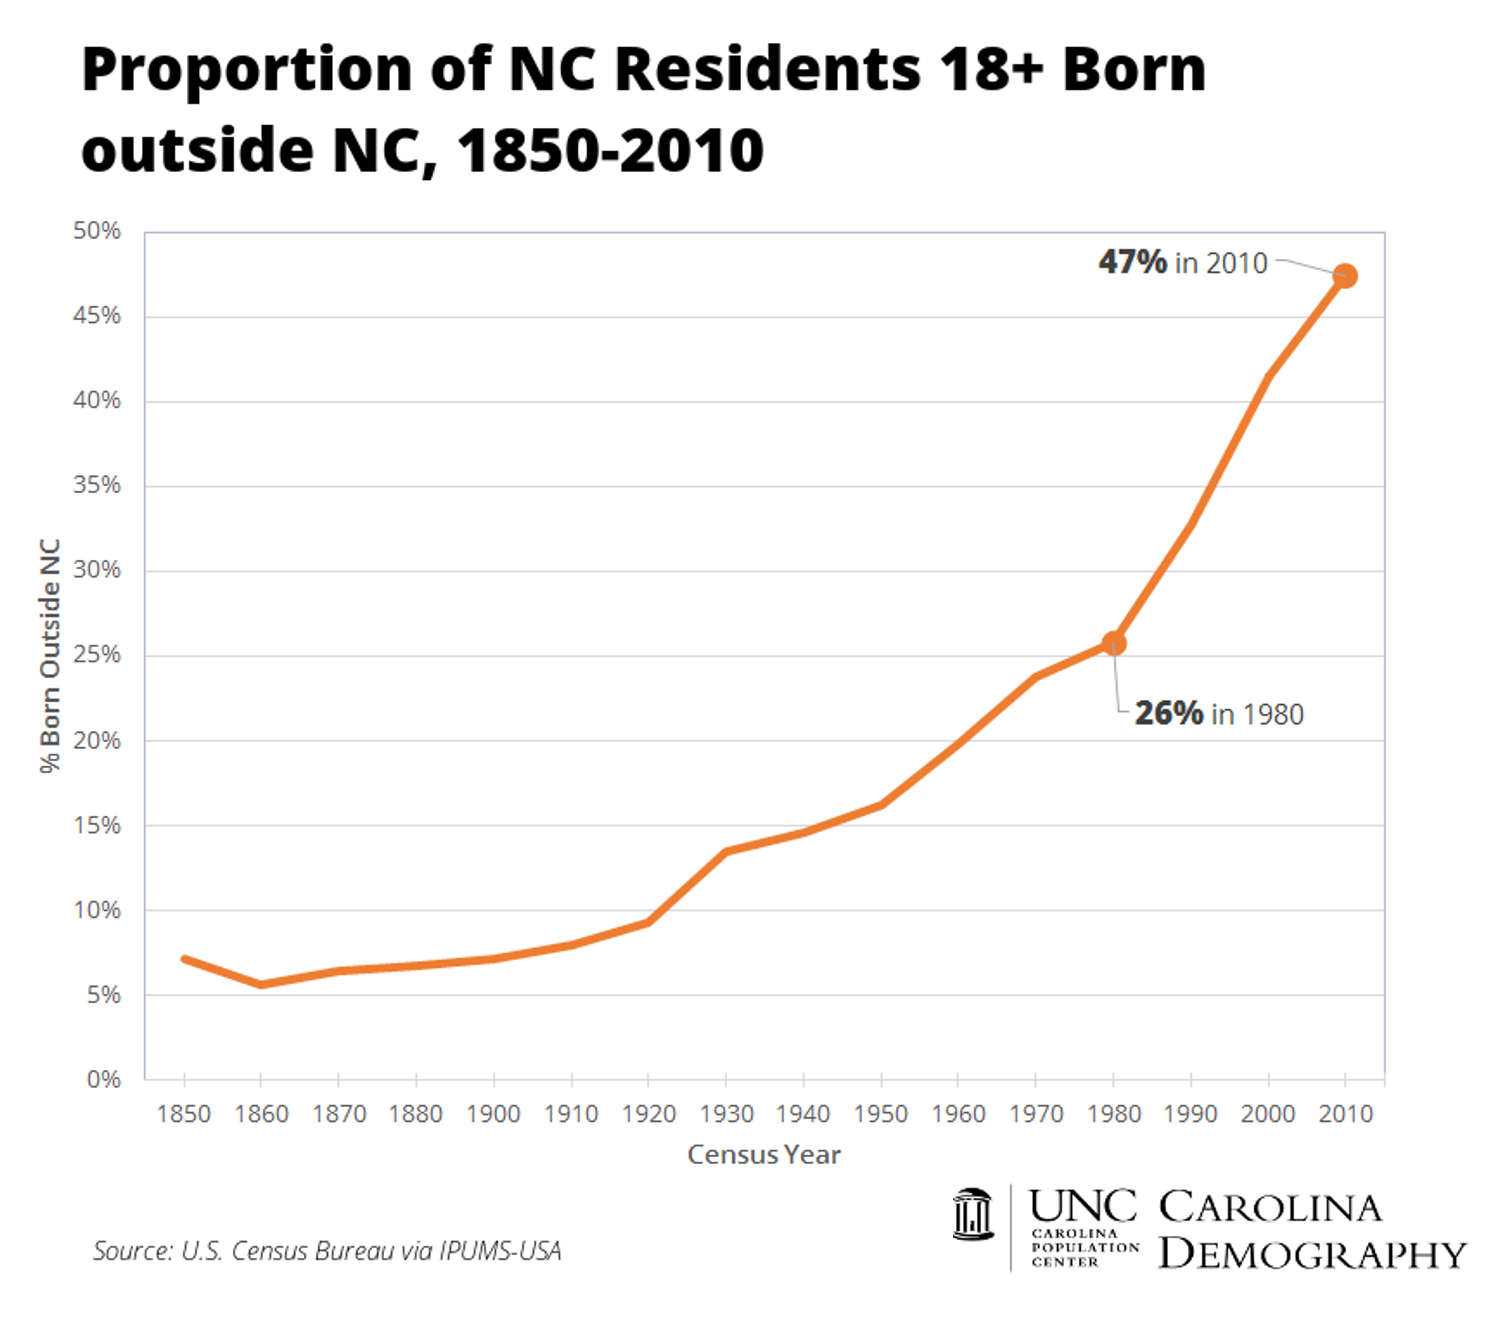
Where were migrants born?
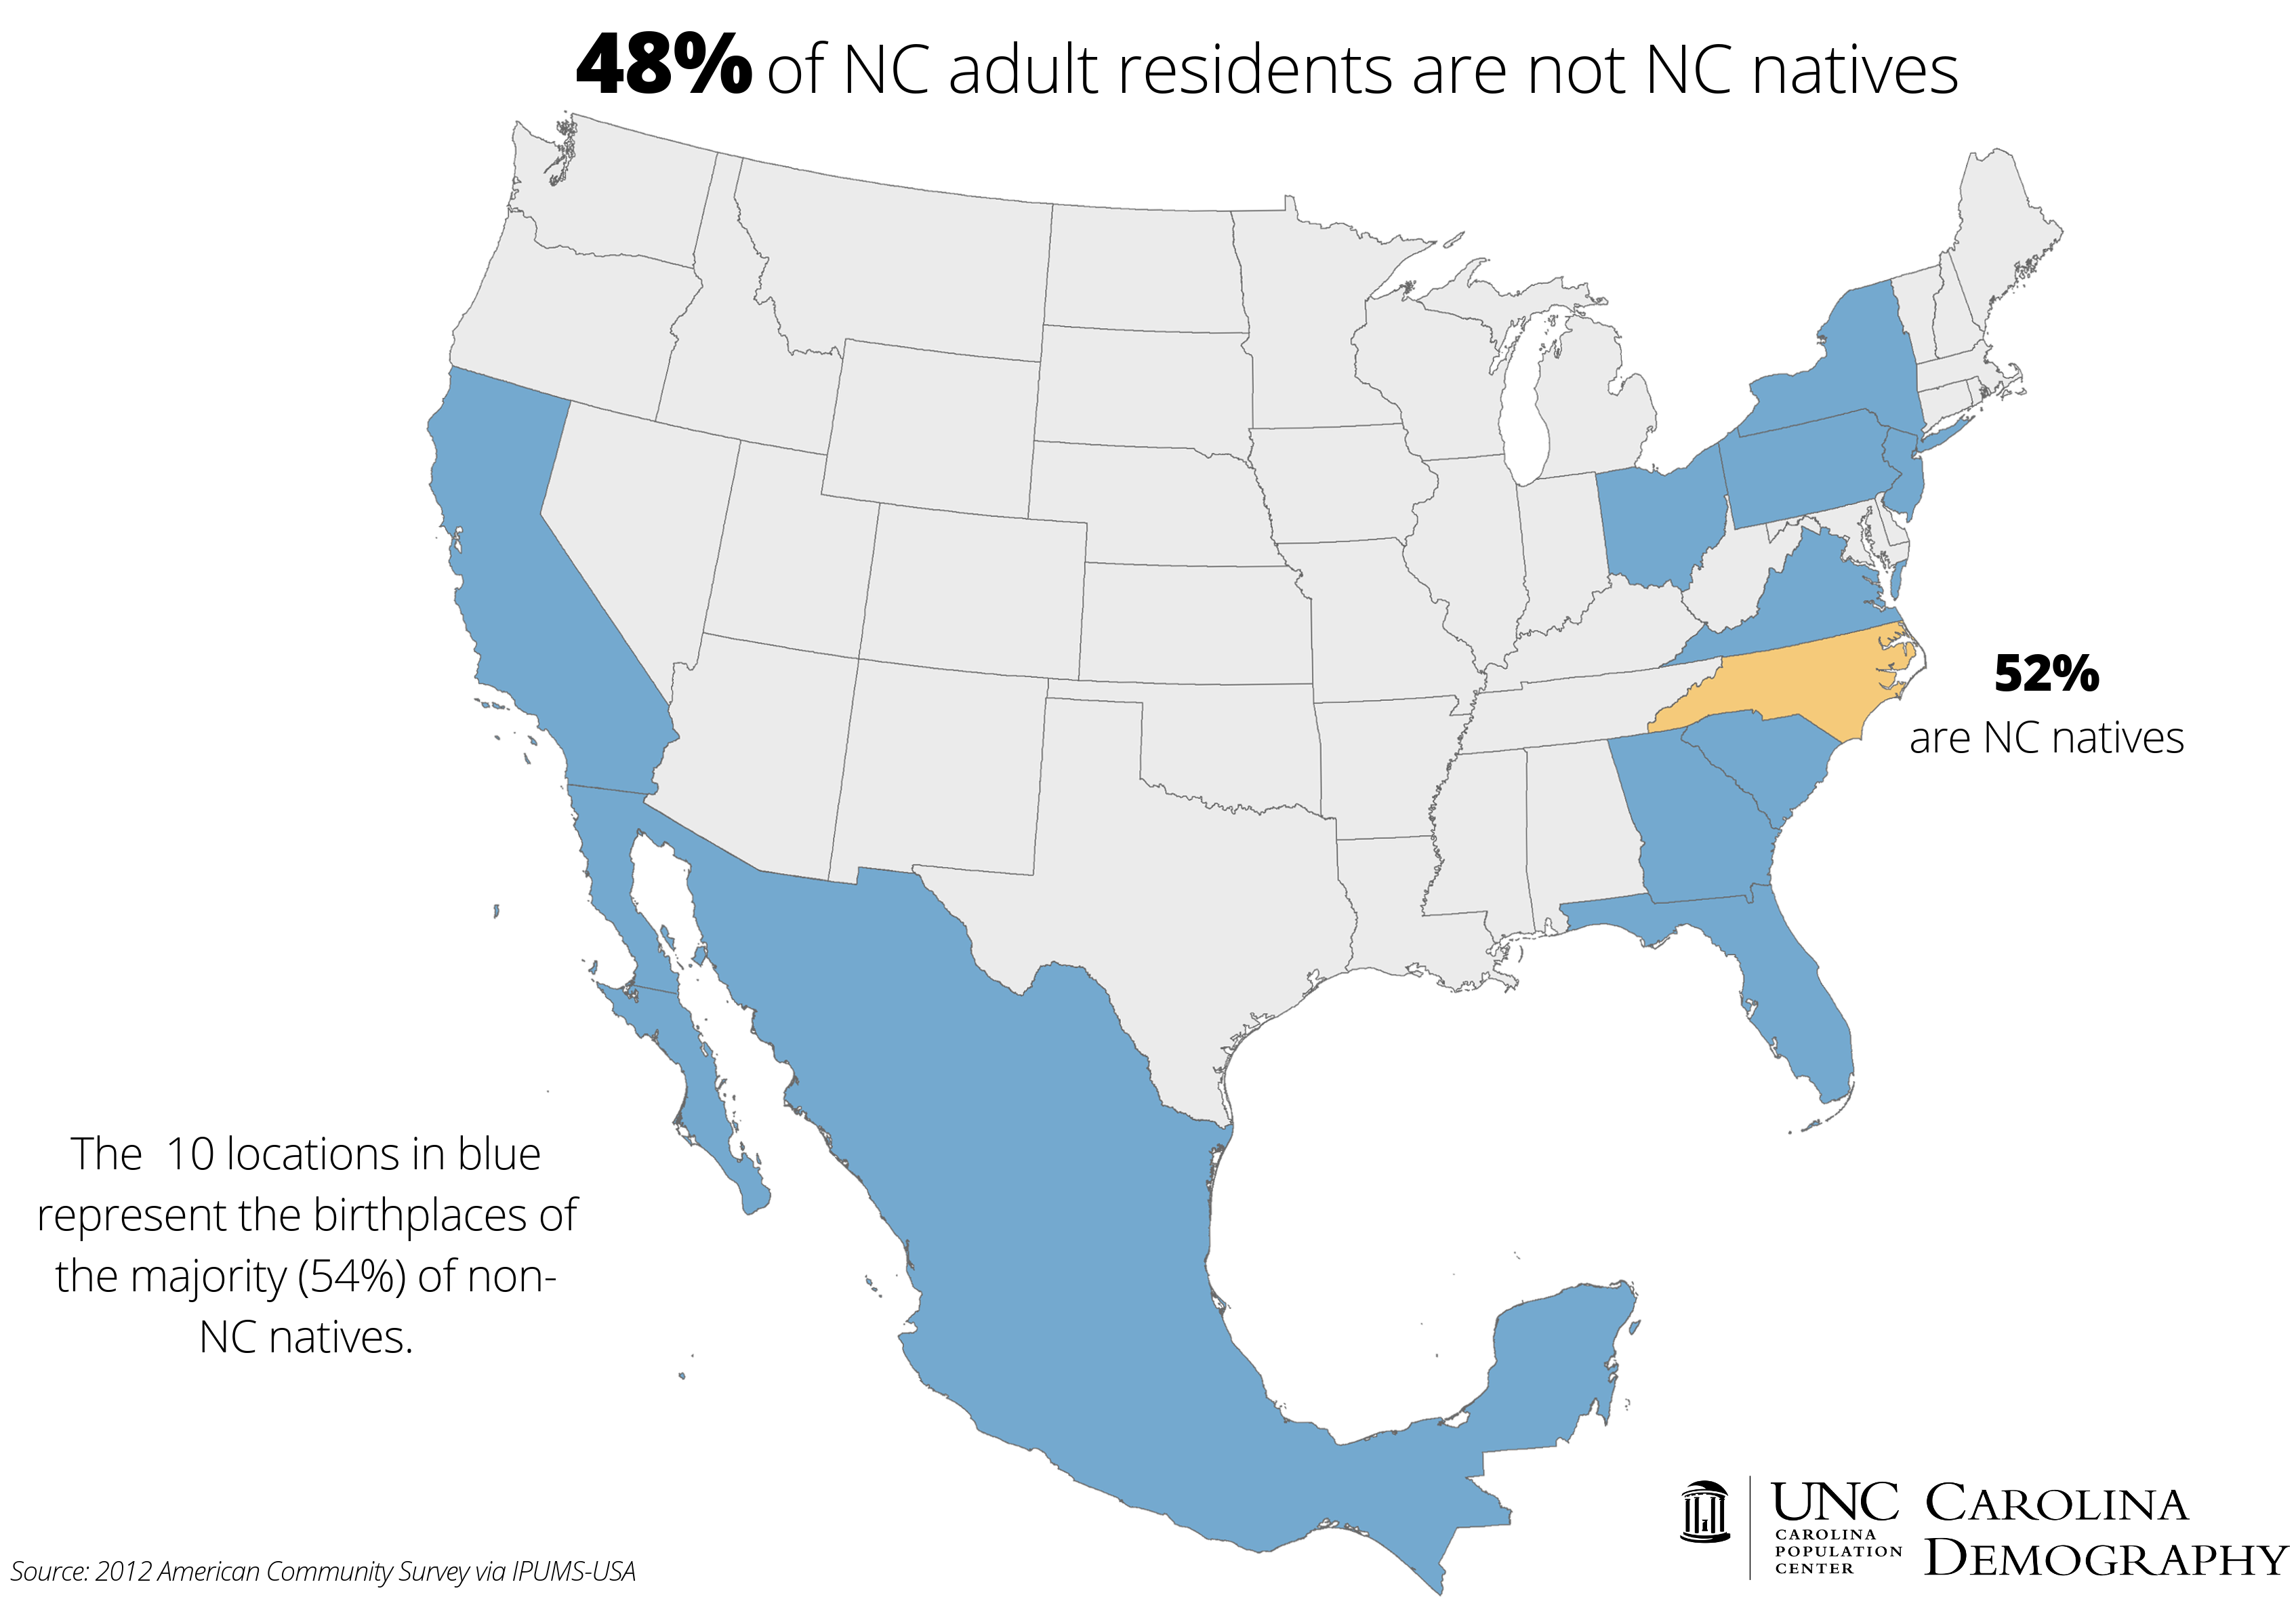
North Carolina is a microcosm of the nation. People move here from every state and U.S. territory and every country around the globe. The map below shows the top 10 places where current North Carolina residents were born.
New York is the most common birthplace of non-native North Carolinians; nearly 383,000 NC adults were born in New York. (This explains, in part, the dominance of Yankees’ fans in North Carolina’s metro areas (and coast) in Facebook’s map of Major League Baseball fans.) The second most common birthplace for non-NC natives is Virginia (253,000) and the third is Mexico (251,000). Migrants from these three places comprise a quarter of North Carolina’s non-native adult population.
Where do they move?
 Migrants to North Carolina do not settle evenly within the state. The map below shows concentrations of non-native North Carolinians by Public Use Microdata Area (PUMA) in the 2012 ACS.
Settlement patterns of non-native North Carolinians reflect the many factors—military, employment, and retirement—that make the state a magnet for migrants. Some of the highest proportions of non-native North Carolinians are near military bases. Seventy-eight percent of adults in Jacksonville and 66% in Fayetteville were not born in North Carolina.
Additional heavy concentrations are in Mecklenburg and Union counties and in Wake, particularly on the side near RTP. Charlotte and the Triangle have been growing for the past 20 years due to thriving economies that attract workers from across the country and the globe. Last, the impact of the retiree population is seen in the higher proportion of non-native North Carolinians on the coast (especially Brunswick County) and in the mountains.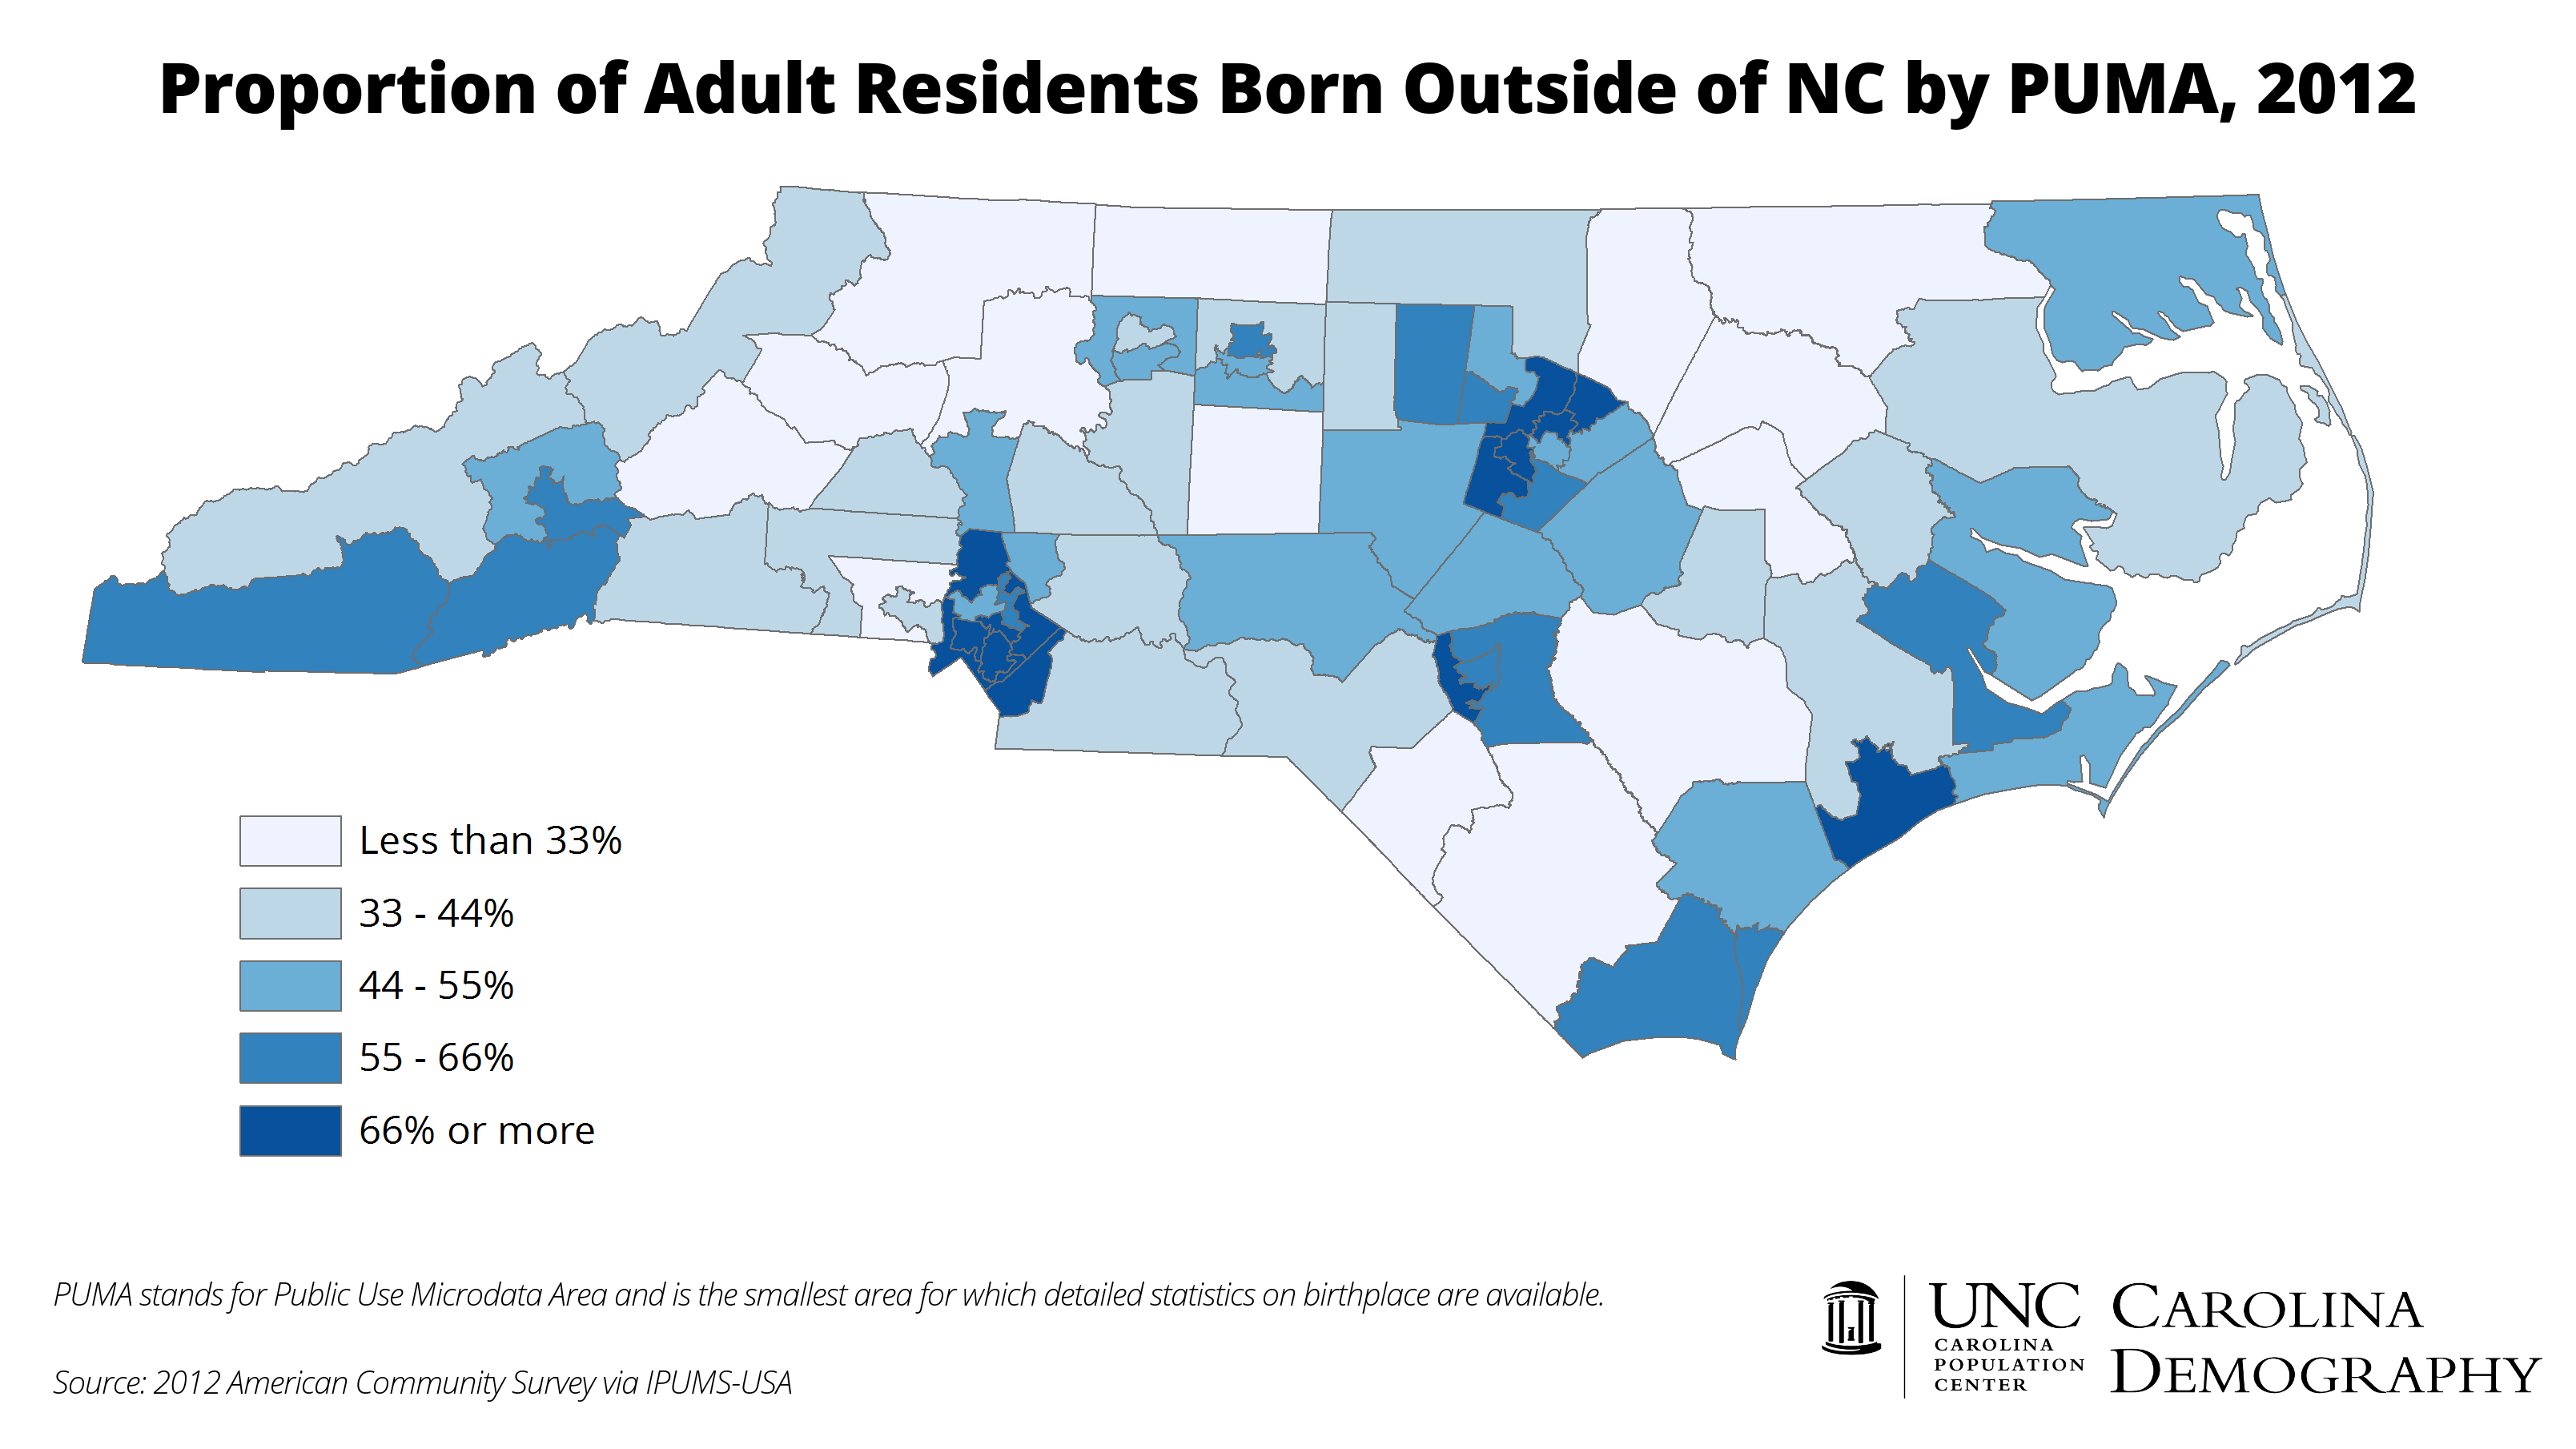
North Carolina: Net Importer of College Graduates
I mentioned last week that you shouldn’t worry about the greater propensity of individuals with college degrees to leave the state. More college graduates move to North Carolina than leave. Among adults 25 and older, 36% of non-NC natives hold a bachelor’s degree or higher compared to 19% of North Carolina natives. This represents more than 1.1 million residents in the state with a bachelor’s or higher that moved here from another state or country.
Not only does North Carolina exert a strong pull that brings individuals from across the globe, its “stickiness” suggests that once individuals come here, they may be here to stay.
Data used in this analysis were drawn from IPUMS-USA.
Your support is critical to our mission of measuring, understanding, and predicting population change and its impact. Donate to Carolina Demography today.