I’ve heard someone joke that, prior to 1980, there were two languages spoken in North Carolina: English and bad English. This probably runs fairly true to most people’s day-to-day experiences before the more recent wave of immigration. In 1980, just over 2% of North Carolina residents age 5 and older, or 130,640 individuals, spoke a language other than English at home. Today, nearly 11% speak a language other than English at home, representing nearly a million North Carolinians.
Although small populations of non-English speakers have long existed throughout the state, the rapid growth in both the number of non-English speakers and the diversity of languages spoken reflect two trends. At the national level, major changes in immigration policy occurred between 1965 and 1990. In 1965, the national origins quota system was abolished, leading to significant increases in immigration from Latin America and Asia. In 1990, the U.S. raised the cap on the number of immigrants allowed to enter the country each year. As these national policies increased the diversity and size of the immigrant population, North Carolina, like other states such as Georgia and Nevada, emerged as a new immigrant destination.
Top 10 Non-English Languages Spoken at Home and Number of Speakers in NC, 1980 v. 2009-2011
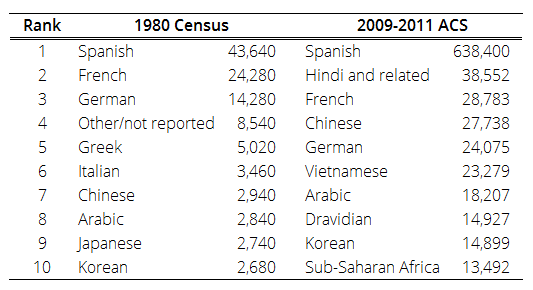
This table shows the top 10 languages other than English spoken in North Carolina, and the number of individuals who reported speaking them, in the 1980 Census and the more recent 2009-2011 American Community Survey (ACS). In 1980, only 4 languages—Spanish, French, German, and Greek—reported more than 5,000 speakers residing in North Carolina. By 2009-2011, almost twenty languages were spoken by more than 5,000 people in the state.
Six languages held a spot in the top 10 in both 1980 and 2009-2011. In both time periods, Spanish was the most common language spoken at home. The gap between Spanish and the second most common language, however, grew substantially as the Spanish-speaking population increased by nearly 600,000 persons since 1980. Compared to Chinese, Arabic, and Korean, which each more than tripled their population of speakers, French and German saw much smaller rates of growth in the number of speakers.
Four new languages entered the top 10 over the past 3 decades: Hindi and related languages, Vietnamese, Dravidian (a language common to Southern India), and Sub-Saharan African languages. The size of the population speaking each of these languages increased more than ten-fold between 1980 and 2009-2011. The largest numerical growth was among the Hindi-speaking population, which grew from 2,500 to more than 38,000 individuals.
It is important to keep in mind that this does not mean that these individuals don’t speak English – nor does it mean that they never speak English at home. It just means that they also speak a language other than English at home. The majority (75%) report speaking English very well or well.
While the growth in the immigrant population has influenced the rise of non-English speaking at home, 22% of foreign born individuals speak only English at home, and more than a third of the population that speaks another language at home were born in the United States. Many of them are the children of immigrants and some have a spouse who is foreign-born, but individuals can speak a language other than English at home for many reasons, such as an interest in bi- or multilingualism for business or travel purposes.
Analysis was restricted to individuals 5 and older. Data used in this analysis were drawn from IPUMS-USA.
Your support is critical to our mission of measuring, understanding, and predicting population change and its impact. Donate to Carolina Demography today.