Visualizing Neighborhood Change, 2000 to 2010
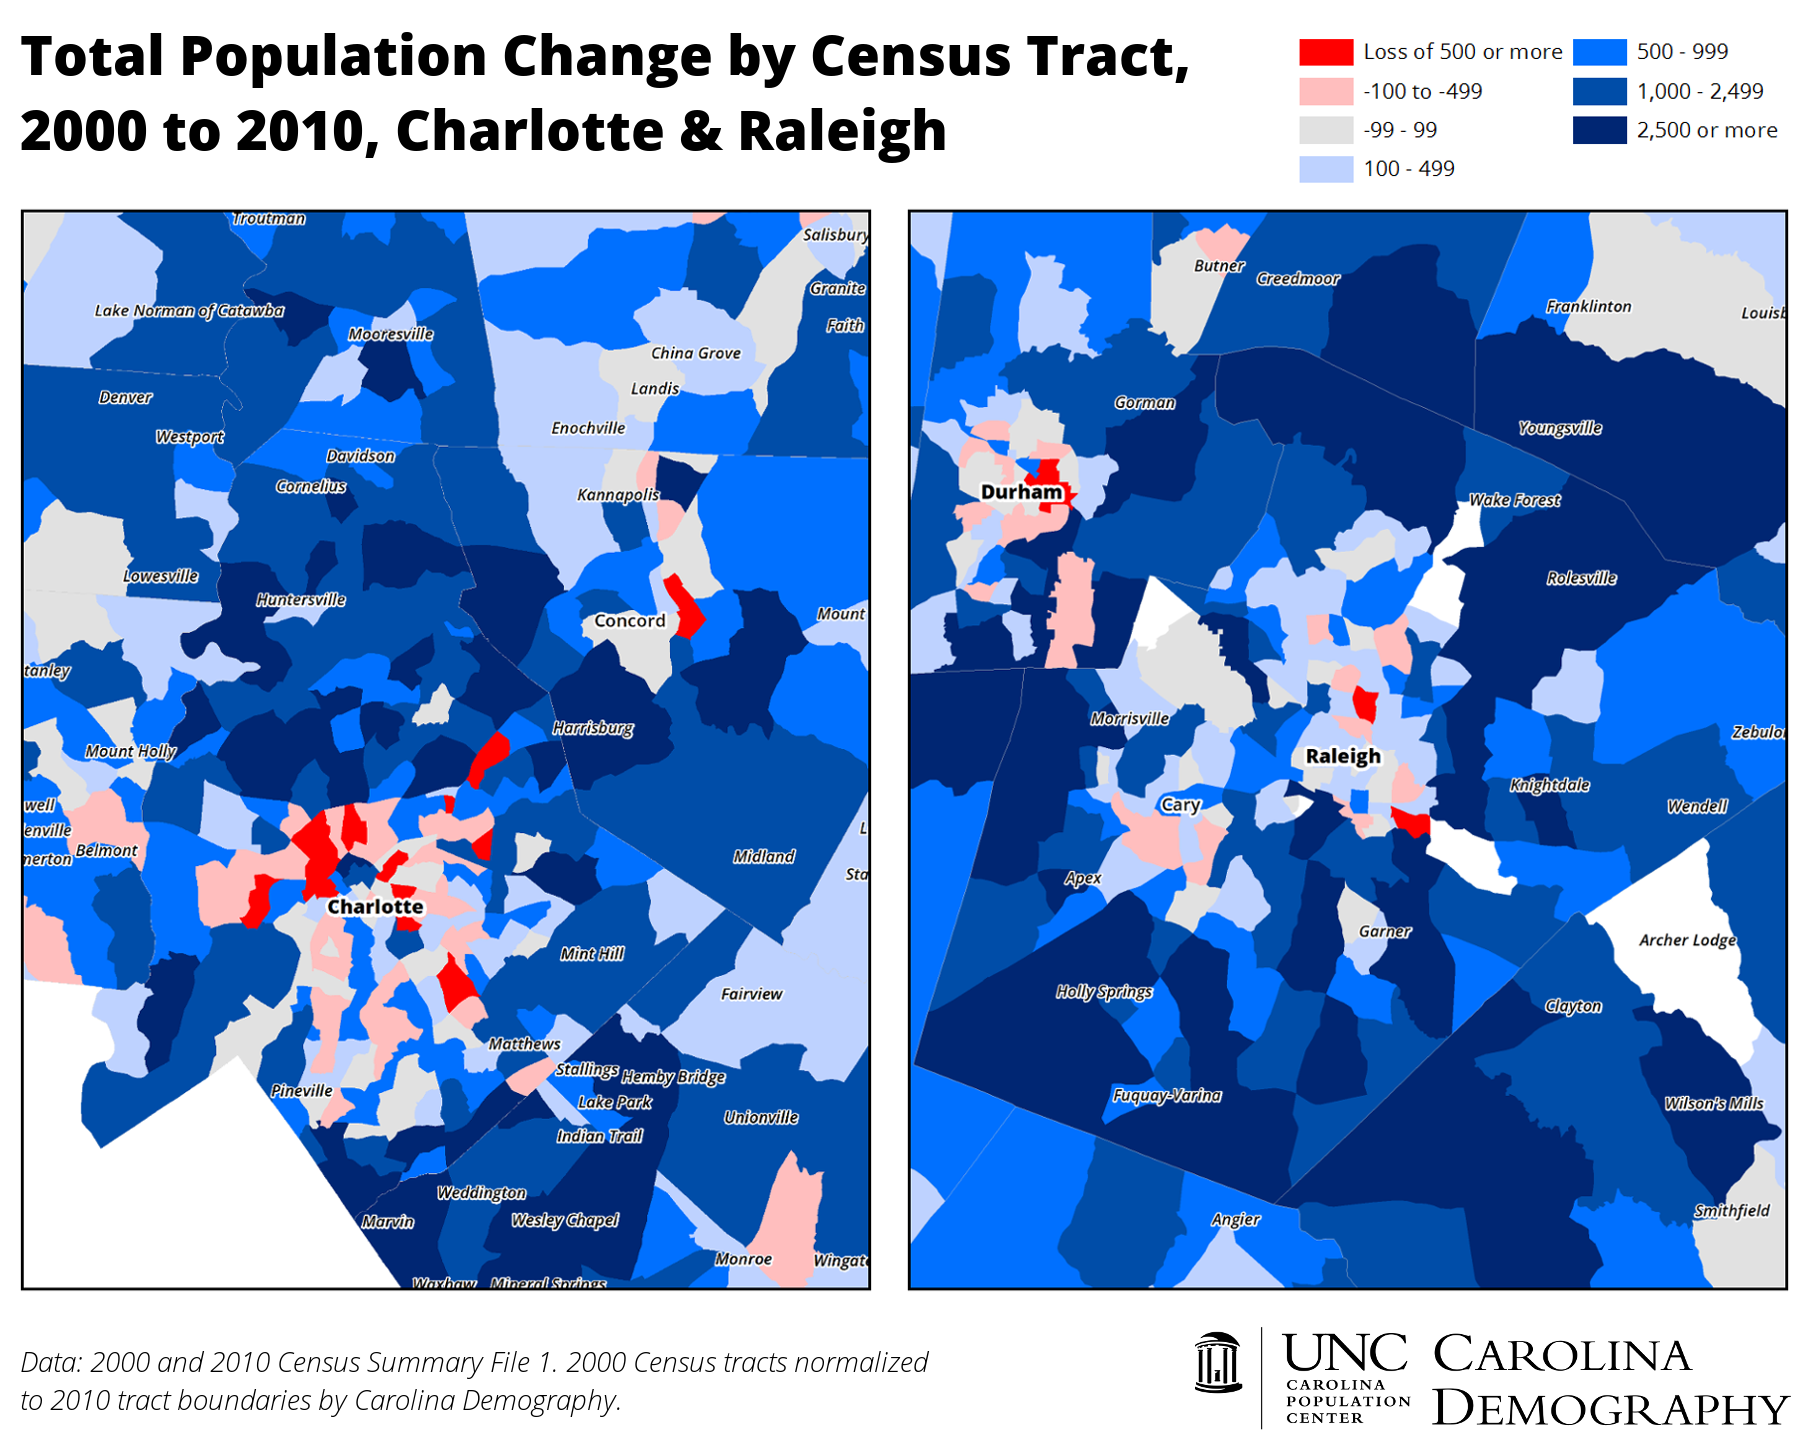
Dynamics of population change at sub-county levels are key to understanding the local impacts of broader demographic shifts. Unfortunately, sub-county geographies, such as census tracts, change substantially from decade to decade, posing a barrier to direct comparison over time.
To overcome this barrier, Carolina Demography developed a methodology to bridge (or normalize) the 2000 Census data into 2010 census tract boundaries. We then used 2010 Census data to directly compare change over time. The maps below highlight geographic variation in two trends impacting the state: (sub)urbanization and growing racial and ethnic diversity.
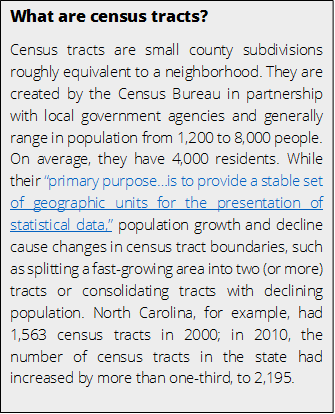
Between 2000 and 2010, North Carolina’s population grew by 1.5 million. As we’ve previously discussed, and as the map below illuminates, population growth was uneven across the state. Population growth clustered around major metropolitan areas, while nearly 1 in 4 census tracts lost population over the decade.
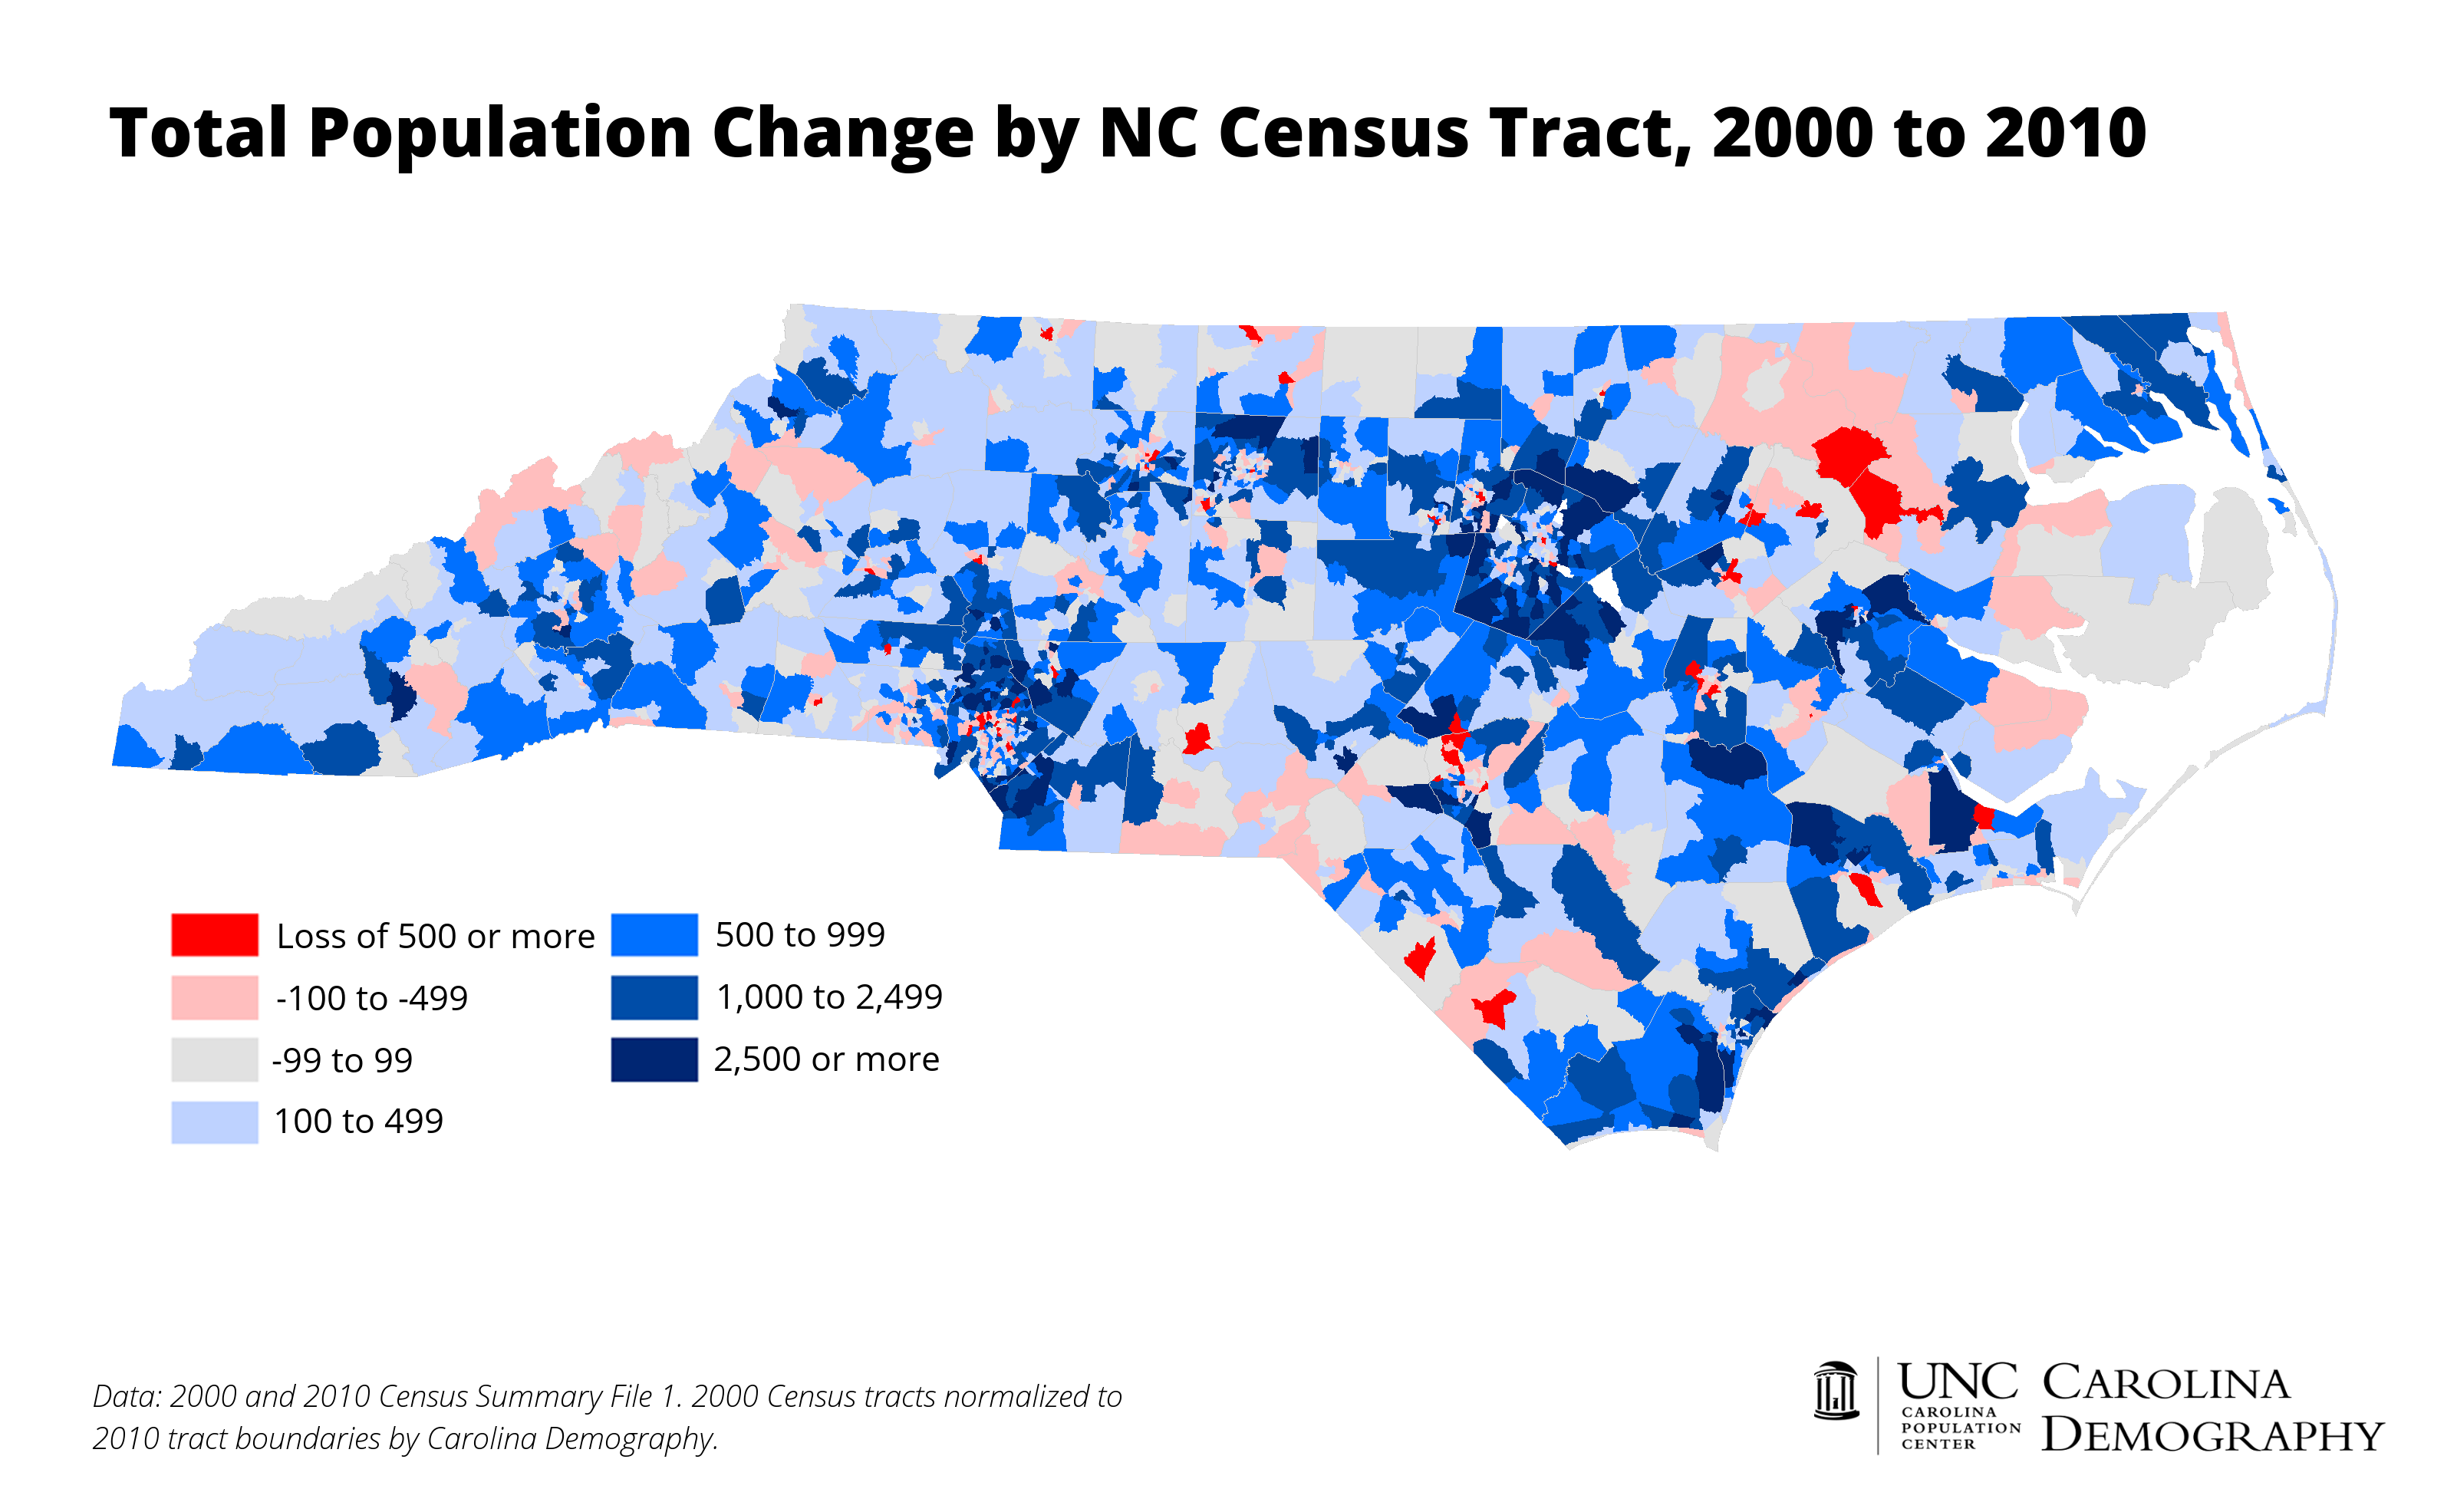
Population loss was not limited to rural census tracts, however. Areas in the central cities of Charlotte, Winston-Salem, Greensboro, Durham, and Raleigh also experienced population declines. At the same time, census tracts in suburban and exurban areas saw significant growth. To the north of Charlotte, for example, census tracts in Huntersville, Cornelius, and Mooresville grew rapidly. These three towns nearly doubled in population between 2000 and 2010. In the Triangle, similarly rapid growth occurred in suburbs such as Apex, Clayton, Fuquay-Varina, Holly Springs, and Wake Forest.
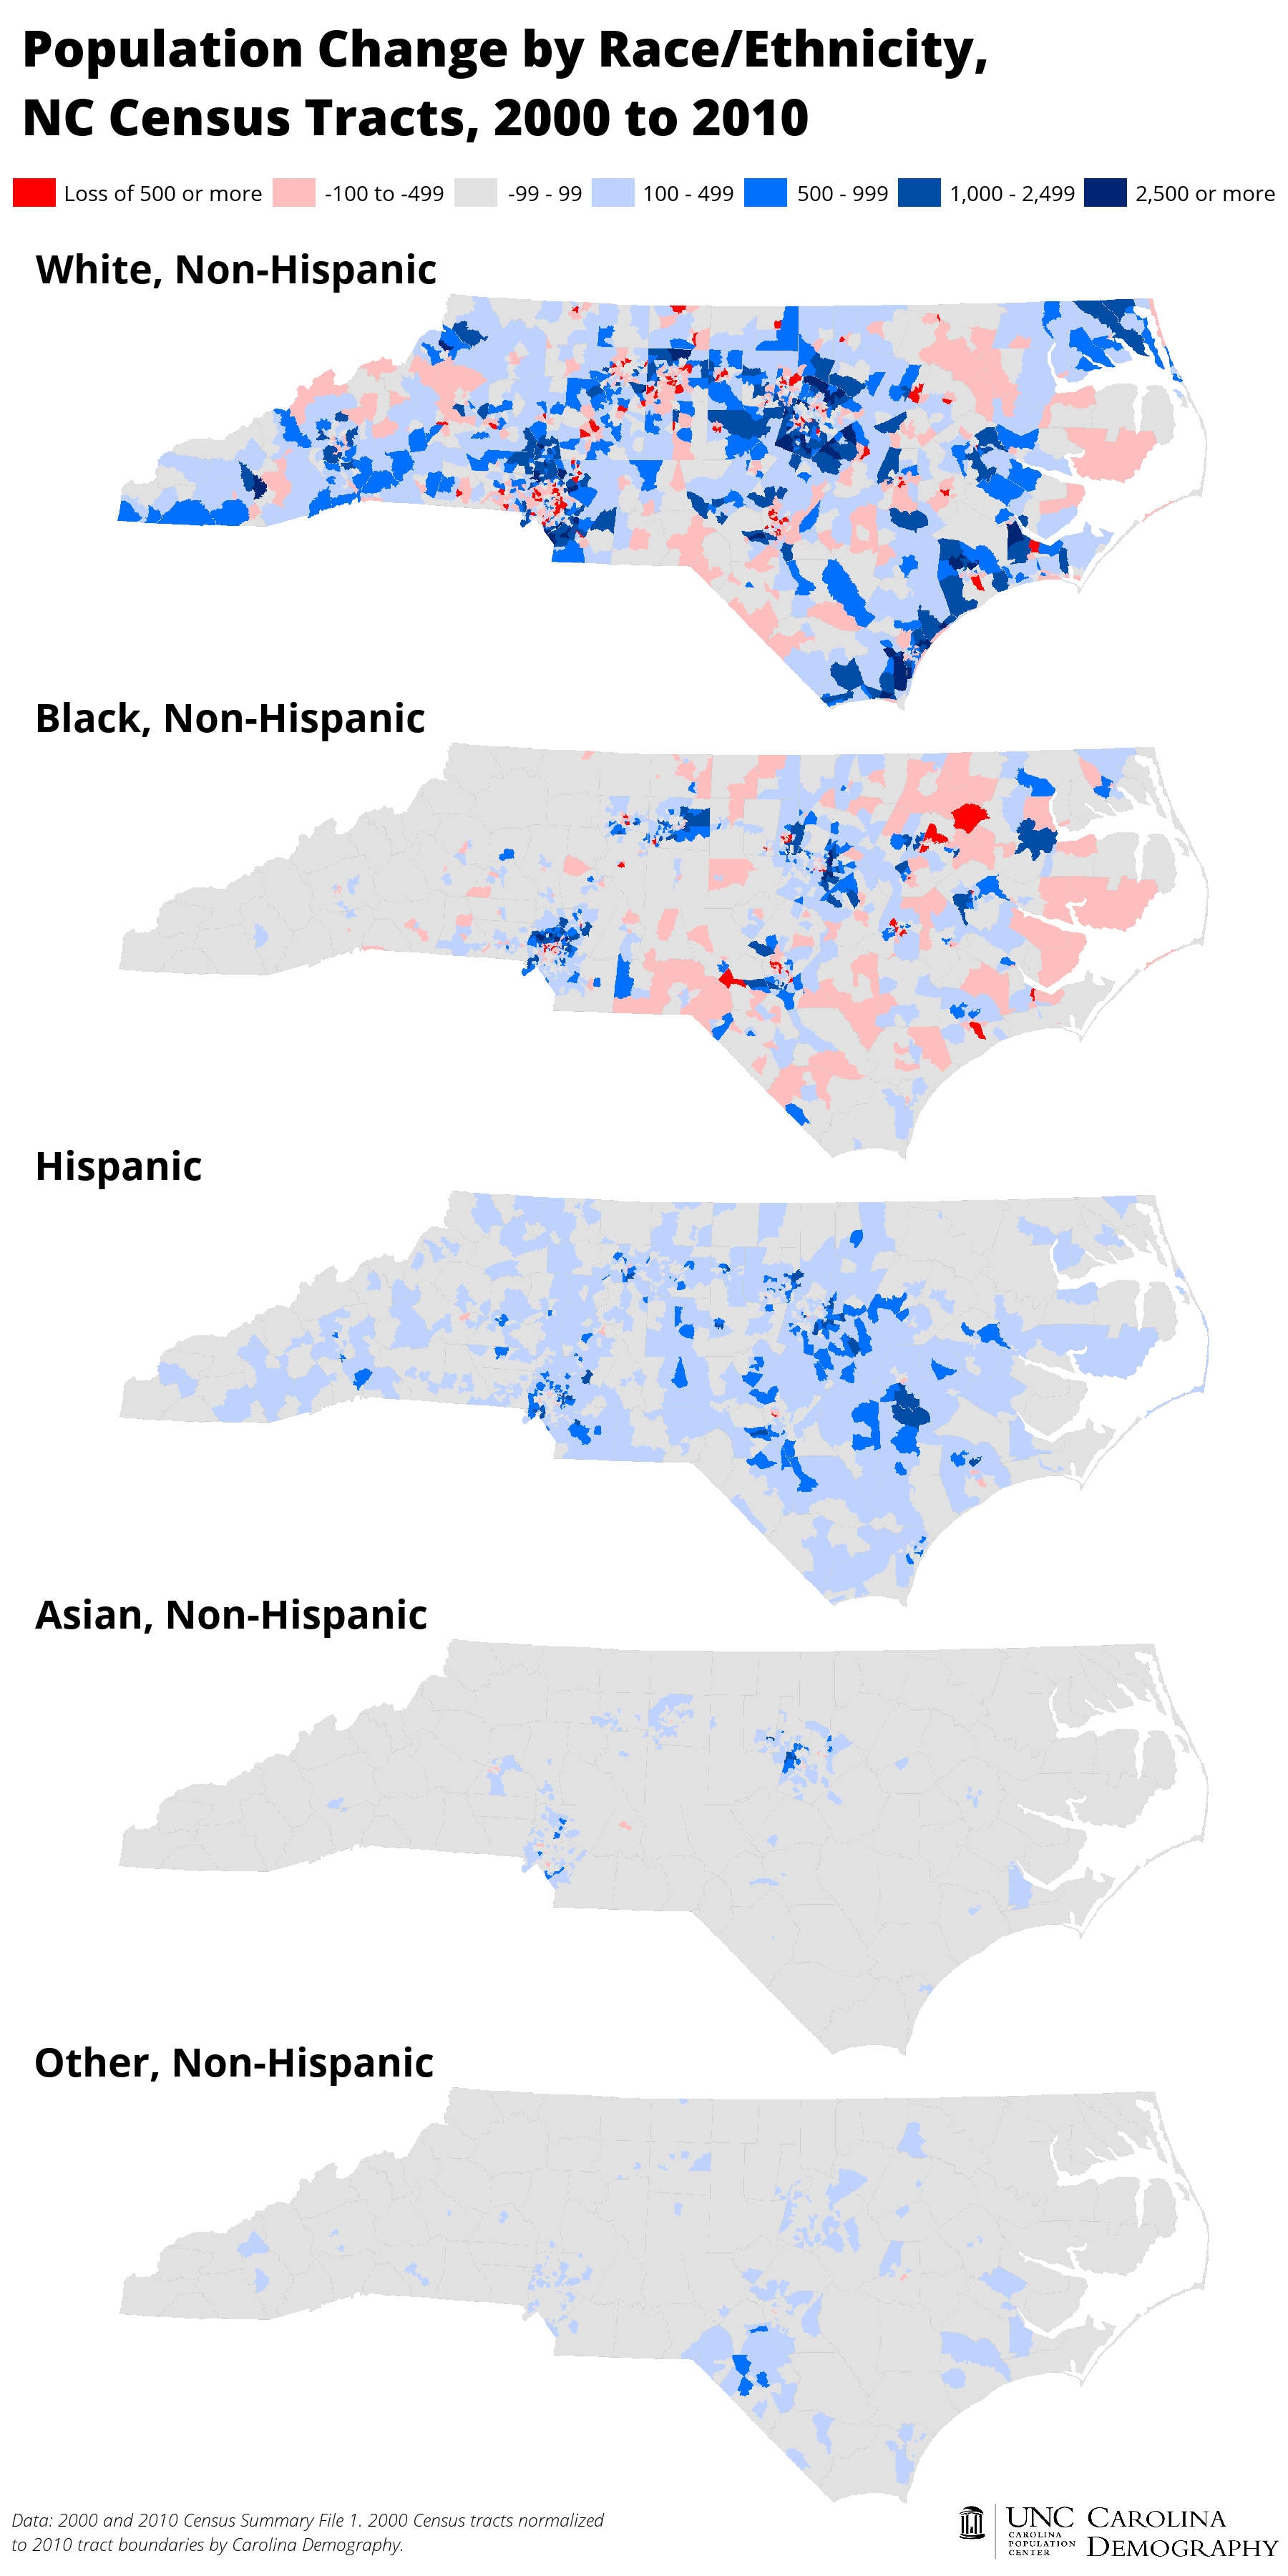
All of North Carolina’s racial-ethnic groups grew between 2000 and 2010. But, they did not grow in all places. In addition, local patterns of population growth and decline varied considerably by race/ethnicity, with significant impacts on racial/ethnic composition.
White, Non-Hispanic
Between 2000 and 2010, North Carolina’s non-Hispanic white population grew by nearly 600,000. Patterns of growth were similar to overall patterns of total population growth and decline, with a more marked decline in white populations in central cities, particularly in Charlotte. The growth of the white population on the coast and in the western areas of the state likely reflects the influx of retirees into the state.
Black, Non-Hispanic
North Carolina’s black population grew by nearly 300,000 between 2000 and 2010. Eastern North Carolina and rural areas had large declines in black population. In contrast, counties home to major urban areas, such as Guilford (Greensboro), Mecklenburg (Charlotte), and Wake (Raleigh), had large increases in their black population.
Hispanic
Between 2000 and 2010, North Carolina’s Hispanic population grew by more than 420,000. Hispanic population growth was nearly universal: 92% of census tracts gained Hispanic residents. The largest growth occurred in the Triangle, Charlotte, Sampson and Lee counties, and the Fayetteville area.
The Hispanic population grew in many areas that lost white and black residents. This has two major impacts on local population. First, it often prevents overall population declines. Second, it can produce dramatic changes in the local racial/ethnic composition. In Sampson County, for example, nearly all of the population growth between 2000 and 2010 was from the Hispanic population. The county proportion of Hispanics increased from 10.8% in 2000 to 16.5% in 2010.
Asian, Non-Hispanic
Unlike the Hispanic population, North Carolina’s Asian population is concentrated in major urban areas. Between 2000 and 2010, North Carolina’s Asian population grew by nearly 100,000. Nearly all of this growth was in the Triangle and Charlotte.
Other, Non-Hispanic
Statewide, the population identifying as some other race increased by more than 75,000 between 2000 and 2010. Similar to patterns of Asian population growth and decline, other race populations are spatially concentrated. The largest increases were in Robeson county and surrounding areas that have large American Indian populations. Additional increases were concentrated in urban areas and near military bases. This is due, perhaps, to two factors: greater diversity in these areas leading to a higher prevalence of interracial marriages and mixed race children and, on average, younger populations that may be more likely to identify as multiracial.
The recession may have dampened the two drivers of population growth—migration and fertility—but it did not eliminate them entirely. Census Bureau population estimates and population projections from North Carolina’s Office of State Management and Budget show persistence in both overall population trends as well as the local patterns of growth. North Carolina’s population will grow and racial and ethnic diversity will increase. In 2020, we will likely see comparably high growth in (sub)urban areas with an intensification of population loss from rural areas hit hard by population aging.
Need help understanding population change and its impacts on your community or business? Carolina Demography offers demographic research tailored to your needs. Contact us today at demography@unc.edu or (919) 962-6151 for a free initial consultation.
Methodology & Data
Carolina Demography used Block Relationship Files released by the Census Bureau and 2000 Summary File 1b (Blocks & Block Groups) data from the National Historical Geographic Information System (NHGIS) to normalize the 2000 Census data into 2010 census tract boundaries. We then used 2010 Summary File 1 data from Social Explorer to directly compare change over time in key population characteristics by 2010 census tract.
Your support is critical to our mission of measuring, understanding, and predicting population change and its impact. Donate to Carolina Demography today.