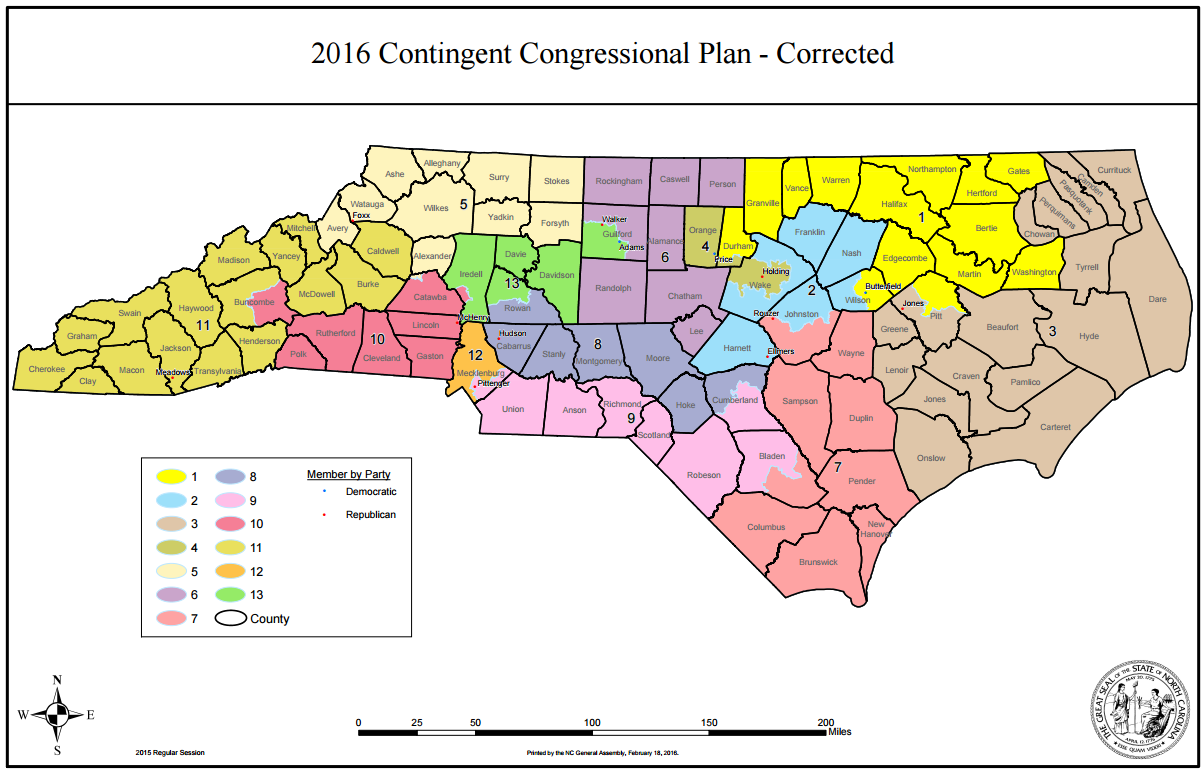
North Carolina’s redrawn congressional districts had equal population in 2010, but North Carolina’s population growth since then has been highly uneven. Two counties, Wake and Mecklenburg, have accounted for nearly half of the state’s growth between 2010 and 2014, while 49 of 100 counties lost population over this time period.
How many people are currently living in the newly defined congressional districts? And how much do their current populations deviate from the equal population size that is the goal of every decennial redistricting?
The U.S. Census Bureau’s American Community Survey provides annually updated demographic information for congressional districts, but it will take some time for the newly defined boundaries to appear in the ACS data. Using our neighborhood change dataset and the July 1, 2014 county estimates from the U.S. Census Bureau, we estimated the number of people living in each of North Carolina’s congressional districts on July 1, 2014. Detailed information on the data and methodology used to produce these estimates is available here.
Each of North Carolina’s 13 congressional districts grew in size between 2010 and 2014, although the rates of growth differed significantly. District 12, located in Mecklenburg, gained nearly 80,000 new residents over that time period, an increase of 10.8% between 2010 and 2014. The 2nd and 4th districts, covering much of the fast-growing Triangle region, experienced similarly high growth, increasing by 9% and 9.3%, respectively.
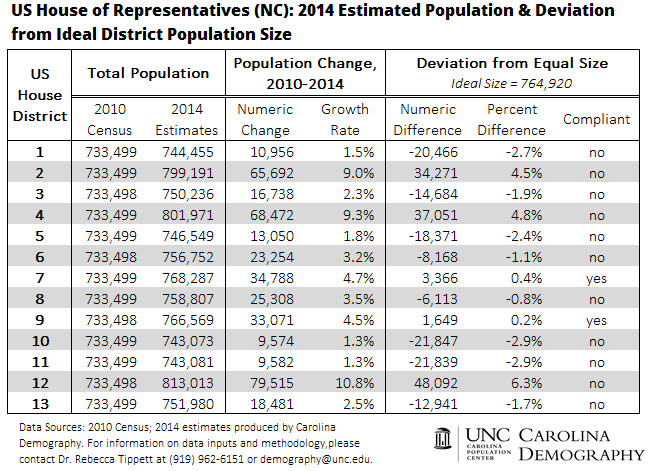
Among the redrawn districts, the slowest growing districts were the 5th, 10th, and 11th districts in the western portion of the state and the 1st District in the northeastern portion of the state. Each of these districts grew by less than 2% between 2010 and 2014.
Ideal population size is equal population across districts. Mathematically, this is calculated by taking the state’s population and dividing by the total number of districts. North Carolina had 9,943,964 residents as of July 1, 2014, according to the U.S. Census Bureau. Divided among North Carolina’s 13 U.S. House districts, this yields an ideal population size of 764,920 per district.
Compliance defines the range of acceptable deviation from ideal size. While U.S. House Districts typically are drawn to be precisely equal, we have allowed for a maximum allowable deviation of 0.5% from ideal size (a spread of 1% total). In 2014, this corresponds to a minimum population of 761,096 and a maximum of 768,745.
Under the newly redrawn boundaries, 11 of the state’s 13 congressional districts were out of compliance according to our 2014 estimates, meaning that they deviated from ideal size by more than 0.5% in either direction.
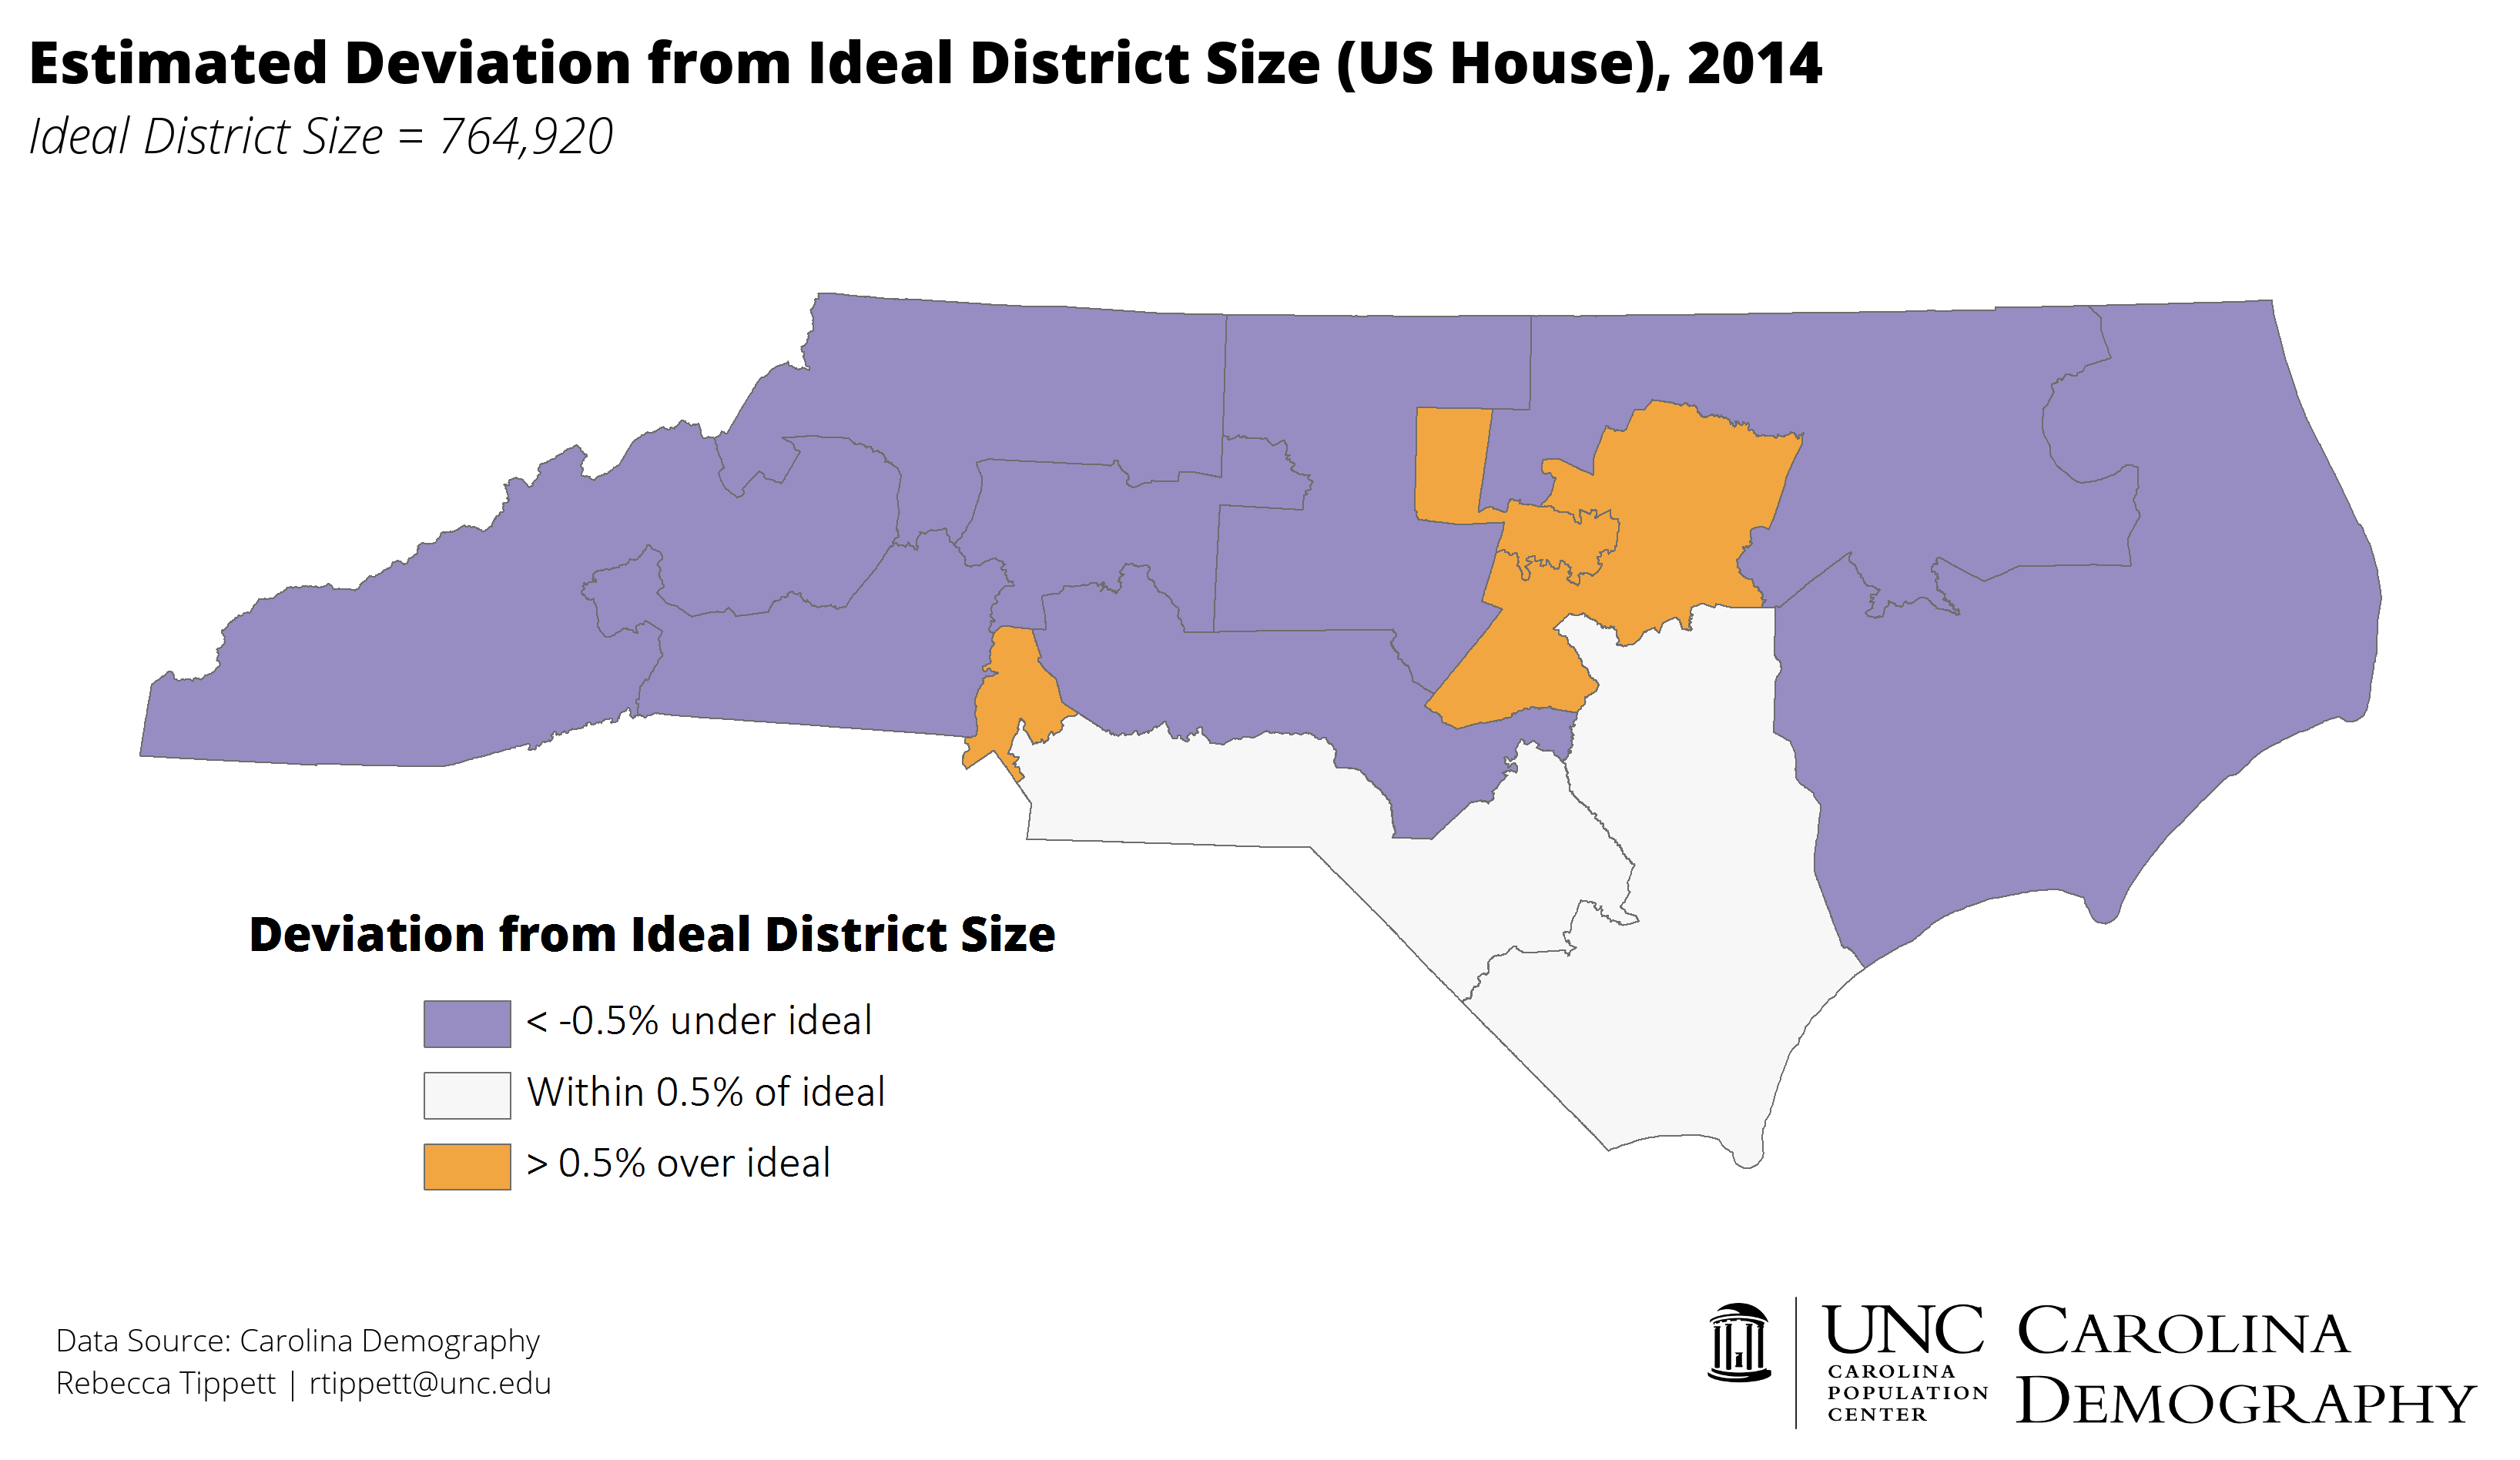
Districts 7 and 9 grew at a similar pace to the state as a whole over this time period—increasing by 4.7% and 4.5%, respectively, compared to North Carolina’s 4.3% growth rate. These were the only 2 districts whose population remained within ideal size in 2014. The fastest-growing districts in Charlotte and the Triangle—districts 2, 4, and 12—were all far above ideal population size. The remaining eight districts all fell below ideal district size in 2014.
Next up: We are working to update our projections for each district’s 2020 population size and implications for the 2021 redistricting process. Subscribe below to receive the latest research from Carolina Demography.
Your support is critical to our mission of measuring, understanding, and predicting population change and its impact. Donate to Carolina Demography today.