Redistricting North Carolina in 2011
Based on the 2010 census, North Carolina’s total number of congressional districts remained the same during the reapportionment process—13 House seats. But not every district drawn 10 years earlier that was based on the 2000 Census data grew at the same rate over the decade. There was significant variation in population growth across the state: major metropolitan areas grew rapidly, while other areas experienced slow growth or population declines. North Carolina’s post-2010 redistricting process required adjusting the district boundaries based on the 2000 Census to account for these different rates of population growth.
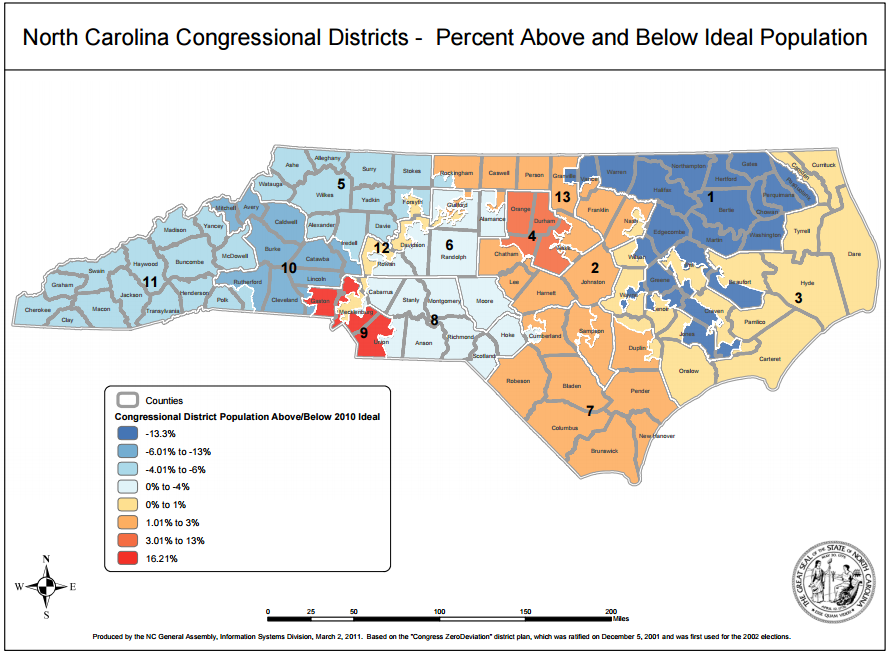
In 2010, North Carolina’s total population was 9.5 million. Split equally across 13 congressional districts, this yielded an ideal district size of 733,499 residents. The most over-populated districts were around the state’s two largest metropolitan areas: Charlotte and Raleigh-Durham-Chapel Hill. District 9, around Charlotte, deviated from the ideal district size by nearly 120,000 people or 16.2% more than the ideal number. District 4, comprised of Orange and Durham counties and parts of Wake County, was 12.7% larger than the ideal district size. In contrast, District 1, in Eastern North Carolina, was under-populated. Its population was significantly smaller than the ideal district size (-13.3%), with nearly 98,000 fewer residents than the ideal size.
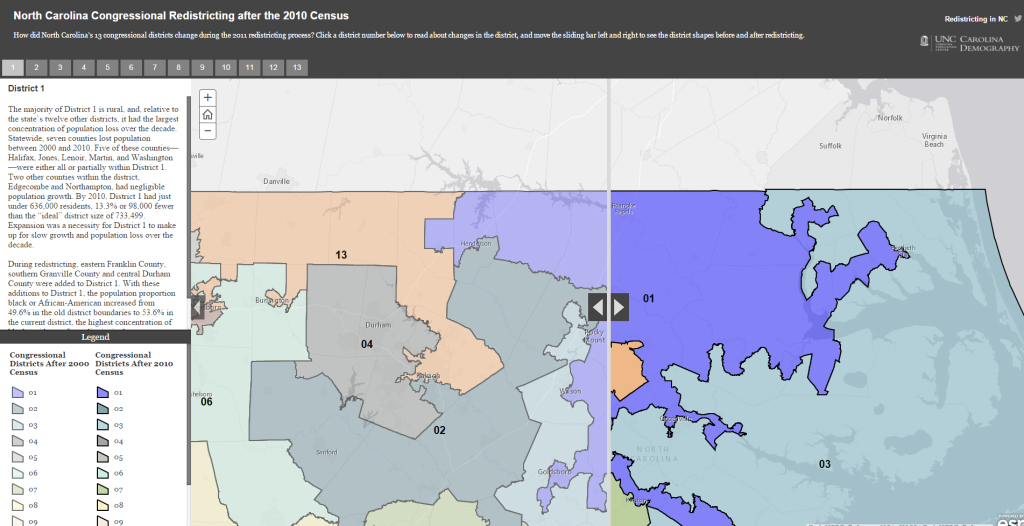
These population shifts necessitated significant changes in congressional district boundaries during redistricting, but they are not the only demographic criteria considered in redistricting. North Carolina also has two “majority-minority” districts to comply with federal requirements in Section 2 of the Voting Rights Act of 1965. The interactive map linked below highlights the shifts in North Carolina’s congressional district boundaries during the post-2010 redistricting process. (Click on the image to access the full interactive map.)
Additional data on North Carolina’s demographic shifts following the 2011 redistricting process are available here.
A PDF document containing maps, demographic shifts, and a description of individual district changes is available for download here (all districts). Individual district profiles are available for download, as well:
District 1 | District 2 | District 3 | District 4 | District 5
District 6 | District 7 | District 8 | District 9 | District 10
District 11 | District 12 | District 13
The interactive map was created by Daniel Tompkins and the story map content was created by Caylin Bullock.
Caylin Bullock is a senior at UNC-Chapel Hill majoring in Mathematical Decision Sciences with a minor in Social and Economic Justice. She is passionate about using data-driven and innovative strategies to serve the broader community. She has worked with No Kid Hungry North Carolina, Carolina Demography, and U.S. Senator Dianne Feinstein’s office. Upon graduation, she hopes to pursue graduate studies in quantitative public policy.
Daniel Tompkins is a junior at UNC-Chapel Hill from Durham, North Carolina, majoring in Geography and minoring in Anthropology and City & Regional Planning. He worked with Carolina Demography during the 2014-15 academic year. His academic interests include urban policy and design as well as demographic analysis.
Your support is critical to our mission of measuring, understanding, and predicting population change and its impact. Donate to Carolina Demography today.