North Carolina’s population has grown by more than 408,000 new residents since the 2010 Census. Of these, 95,000 were added between July 1, 2013 and July 1, 2014. New county population estimates from the U.S. Census Bureau highlight how counties and metropolitan areas changed over this same time period.
In many ways, the 2014 estimates are a continuation of the population trends we saw in the 2013 estimates: metropolitan regions are driving the state’s overall growth; net migration is the major factor in state and county growth patterns; and about half of the state’s counties have seen population losses since 2010. This stability is to be expected. Barring broader economic or environmental shifts, demographic trends tend to continue in steady, predictable ways, especially over short time intervals, such as the one year between population estimates releases.
Here’s what you need to know:
Mecklenburg County has passed the 1 million mark. As of July 1, 2014, the county had 1,012,539 residents. Mecklenburg has grown by 10.1% or nearly 93,000 since the 2010 Census.
Wake County’s population trailed Mecklenburg’s by an estimated 13,850 residents, putting Wake just 1,300 residents away from the 1 million mark as of July 1. This means that Wake, too, has already surpassed the million mark, and may have passed it even earlier than the mid-August 2014 estimated date.
Although the current population estimates suggest that Wake is growing slightly faster than Mecklenburg, increasing by 10.8% or 98,000 residents since the Census, the current growth differential is not enough to push Wake’s population past Mecklenburg’s by 2020.
Guilford County, the state’s third most populous county, passed the half million mark in the July 1, 2012 population estimates and has continued to grow. The county has added an estimated 6,000 new residents each year since 2010.
The 2014 estimates mark a population milestone for Buncombe County: its population passed the quarter million mark. Buncombe had just over 238,000 residents in the 2010 Census and grew by more than 12,000 residents between 2010 and 2014.
North Carolina’s population officially surpassed Michigan’s in 2014, making North Carolina the 9th most populous state in the nation. Mecklenburg and Wake helped to drive the state’s overall population growth and their relative population rankings improved, as well.
Among the nation’s 3,142 counties, Mecklenburg was the 49th largest in 2010 and Wake was the 56th largest. On July 1, 2014, Mecklenburg was the 41st largest county and Wake the 44th largest.
Four North Carolina counties—Wake, Brunswick, Harnett, and Mecklenburg—have seen population increases of over 10% between 2010 and 2014. Of the ten fastest growing counties since 2010, three—Wake, Durham, and Chatham—are in the Triangle region. Another three—Mecklenburg, Union, and Cabarrus—are in the Charlotte metropolitan region. With the exception of Harnett, which belongs to the Dunn micropolitan region, the remaining counties in the top 10 are all in metropolitan statistical areas (MSAs): Brunswick is in the Myrtle Beach MSA and adjacent to Wilmington; Hoke is part of the Fayetteville MSA; and Pender is part of the Wilmington MSA.
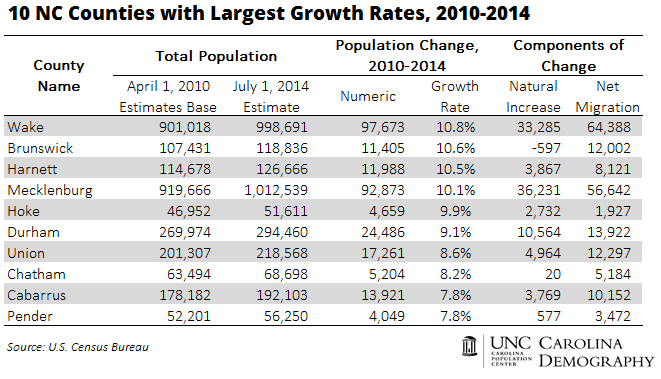
Note that the components of population growth were varied across these ten counties, reflecting underlying differences driving their growth. Brunswick is a major retiree destination, which causes its age structure to shift relatively older; as a result, the county has experienced natural decrease, or more deaths than births. But the impact of natural decrease is more than offset by the large in-migration of retirees into the county. Similarly, Chatham County is a retiree destination, and its population growth is also almost entirely due to net migration.
In contrast, Hoke County has a much younger population than many other counties in the state due to the presence of individuals employed at Fort Bragg. As a result, it is the only county among the top 10 fastest growing to have more population growth from natural increase (more births than deaths) than net migration between 2010 and 2014.
Although most of the state’s metropolitan regions have seen steady growth since 2010, nearly half of North Carolina counties (49) lost population between 2010 and 2014.
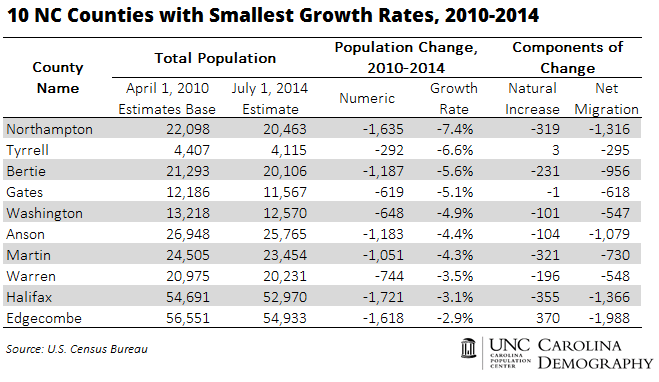
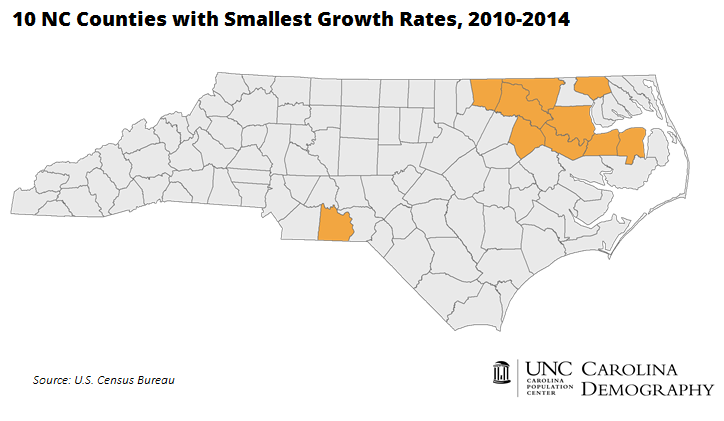
The most significant concentrations of population loss were seen in the northeastern region of the state. Among the 10 counties with the smallest growth rates, nine were located in the northeastern portion of the state near the Virginia border. Virtually all of these counties are experiencing the combined impacts of net out migration and natural decrease (more deaths than births) due to population aging.
Note: Net migration is calculated as the difference between total estimated population change and natural increase (change-(births-deaths)). The District of Columbia was included as one of the 3,142 counties in the nation for purposes of ranking county size.
Your support is critical to our mission of measuring, understanding, and predicting population change and its impact. Donate to Carolina Demography today.