NC in Focus: Homeownership Rates, 1976-2014
In the past few years, there have been many articles about declining home ownership. Nationally, the March Current Population Survey (CPS) shows that homeownership peaked at 69.2% of households in 2005 and has declined steadily since then. In the most recent data, the U.S. homeownership rate was 64.6% in 2014. This is the lowest homeownership rate since 1995, but not the lowest recorded in this data: 63.6% of U.S. households owned or were in the process of buying their homes in 1986.
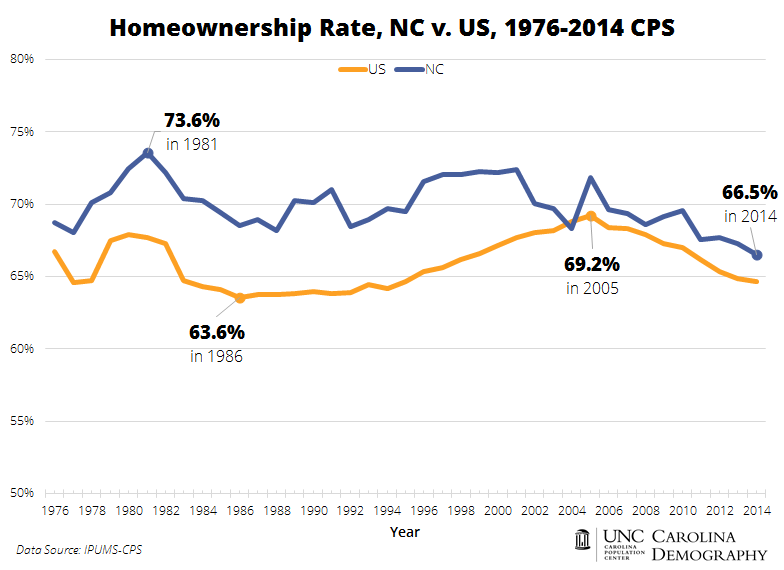
In nearly all years between 1976 and 2014, North Carolina residents have a higher rate of homeownership than the national average. Trends in homeownership rates for North Carolina are slightly less stable than the national trends, due to the smaller sample size at the state level, but the general pattern is similar. North Carolina homeownership hit a high of 73.6% in 1981, then declined slightly before rising again and holding steady at the low 70s before 2005. After 2005, homeownership rates declined steadily. North Carolina’s homeownership rate was 66.5% in 2014, the lowest it has been at any point in the CPS data.
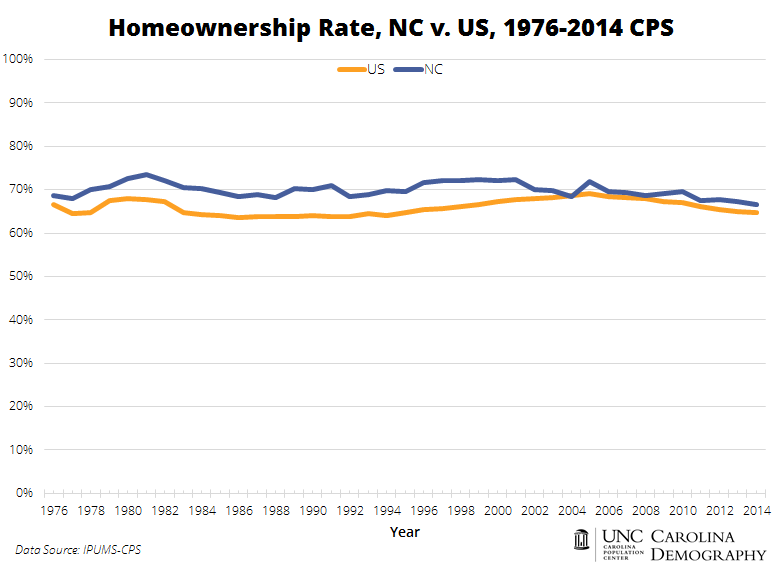
Note: The chart above sets the axis at 50% and above to highlight variation in the homeownership rate over the past 38 years. This can make the decline look more pronounced than it would if we started the axis at zero. Here is the same data displayed with a different axis range. Although homeownership has been declining in recent years, it has historically varied within a range of about 6-7%: between 63.6-69.2% for the U.S. and 66.5-73.6% for North Carolina.
Your support is critical to our mission of measuring, understanding, and predicting population change and its impact. Donate to Carolina Demography today.