Gross domestic product or GDP captures the market value of all goods or services produced within a country (or other defined region) in a given year. Put another way,
GDP = Personal Consumption + Business Investment + Government Spending + (Exports – Imports)
In 2013, the United States had a GDP of nearly $17 trillion – the largest GDP for a single country in the world. To put this in perspective, the U.S. GDP is equivalent to the combined GDPs of three of the other top 6 countries: China (#2 with $9.2 trillion), Japan (#3 with $4.9 trillion), and the United Kingdom (#6 with $2.7 trillion).
Overall, the U.S. accounted for 22.2% of global GDP in 2013, though the 316 million U.S. residents represented just 4.4% of the world’s 7.1 billion population. It can be hard to understand the sheer size of the American economy; one way that people have tried to provide perspective is to make comparisons between the GDP of U.S. states and the GDP of other countries (see, for example, these maps from 2007, 2012, and 2013).
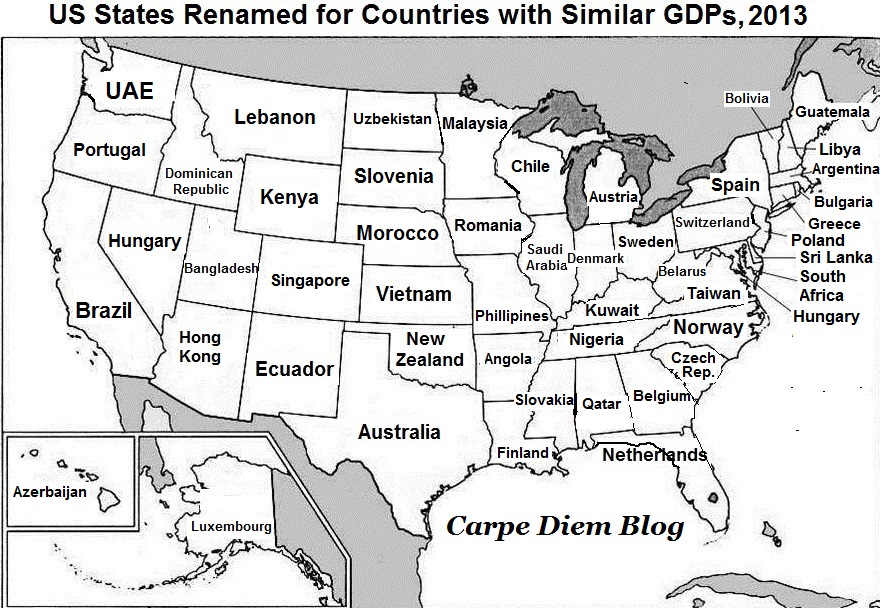
Source: Mark J. Perry, AEI
With a GDP of $2.2 trillion in 2013, California would be the 9th largest economy in the world, similar in size to Brazil and ahead of Italy, Russia, India, and Canada. Texas ($1.5 trillion) and New York ($1.3 trillion) would be in the top 15.
Among the states, North Carolina grew from the 12th largest GDP in 1997 to the 9th largest in 2013. If North Carolina were a country, its GDP of $471 billion would be 28th in the world, just below Norway ($513 billion) and above Venezuela ($438 billion). If the U.S. states were treated as individual countries, North Carolina would be the 35th largest economy in the world.
North Carolina is the second largest economy after Florida in the twelve state Southeast region that also includes Alabama, Arkansas, Georgia, Kentucky, Louisiana, Mississippi, South Carolina, Tennessee, Virginia, and West Virginia. The Southeast had a combined GDP of $3.6 trillion in 2013. This is roughly equal to Germany’s GDP ($3.7 trillion) or the GDP of all countries in the Middle East and North Africa ($3.4 trillion).
Keep in mind that GDP is just one of many metrics that tell us about the health of the overall economy. And, just as a singular health metric in isolation tells us little about a person’s overall physical health, a singular economic measure cannot tell us everything there is to know about economic well-being in a given region.
Sources
GDP by country was obtained from The World Bank databank. State data were obtained from the U.S. Bureau of Economic Analysis’s regional data on GDP by State and Metropolitan Area.
Your support is critical to our mission of measuring, understanding, and predicting population change and its impact. Donate to Carolina Demography today.