College Bound: Out-of-State Students
Across the 16 universities in the UNC system, the proportion of incoming first-year students from out-of-state varies widely. Between 2009 and 2013, for example, nearly three-fifths of incoming first-year students at the UNC School of the Arts were from out-of-state; at the other extreme, only 4% at UNC Pembroke were from outside of North Carolina. Among the five largest schools, UNC Chapel Hill has the highest percentage of out-of-state students (17%), followed by East Carolina (15%), NC State (12%), Appalachian State (11%), and UNC-Charlotte (9%). Which schools are college-bound high school seniors from each state most likely to attend?
As in my previous posts on college attendance by county, I used the “Home Base of Students” data and focused solely on first-year college students who were new high school graduates. I looked at the average of 5 years of student enrollment records—2009 to 2013—to smooth random fluctuations over time. The school that received the largest average number of graduates was designated the school that high school graduates from that state were most likely to attend.
The UNC System
In the county analysis, few counties were Carolina blue. At the end of the post, I asked, “Because UNC Chapel Hill has the largest proportion of out-of-state students [among the 5 largest UNC schools], will a state-by-state analysis reveal different patterns of dominance?” It does indeed.
The map below shows the most likely college destination of high school graduates by state. UNC-Chapel Hill is the most likely destination of college-bound seniors in 19 states and is tied with NC State and Winston-Salem State in Wyoming. On average, Florida sends 77 recent high school graduates to Chapel Hill each fall, New York sends 67, and Georgia sends 61. Between 2009 and 2013, no first-year students at UNC-Chapel Hill came from Alaska, Montana, or North Dakota.
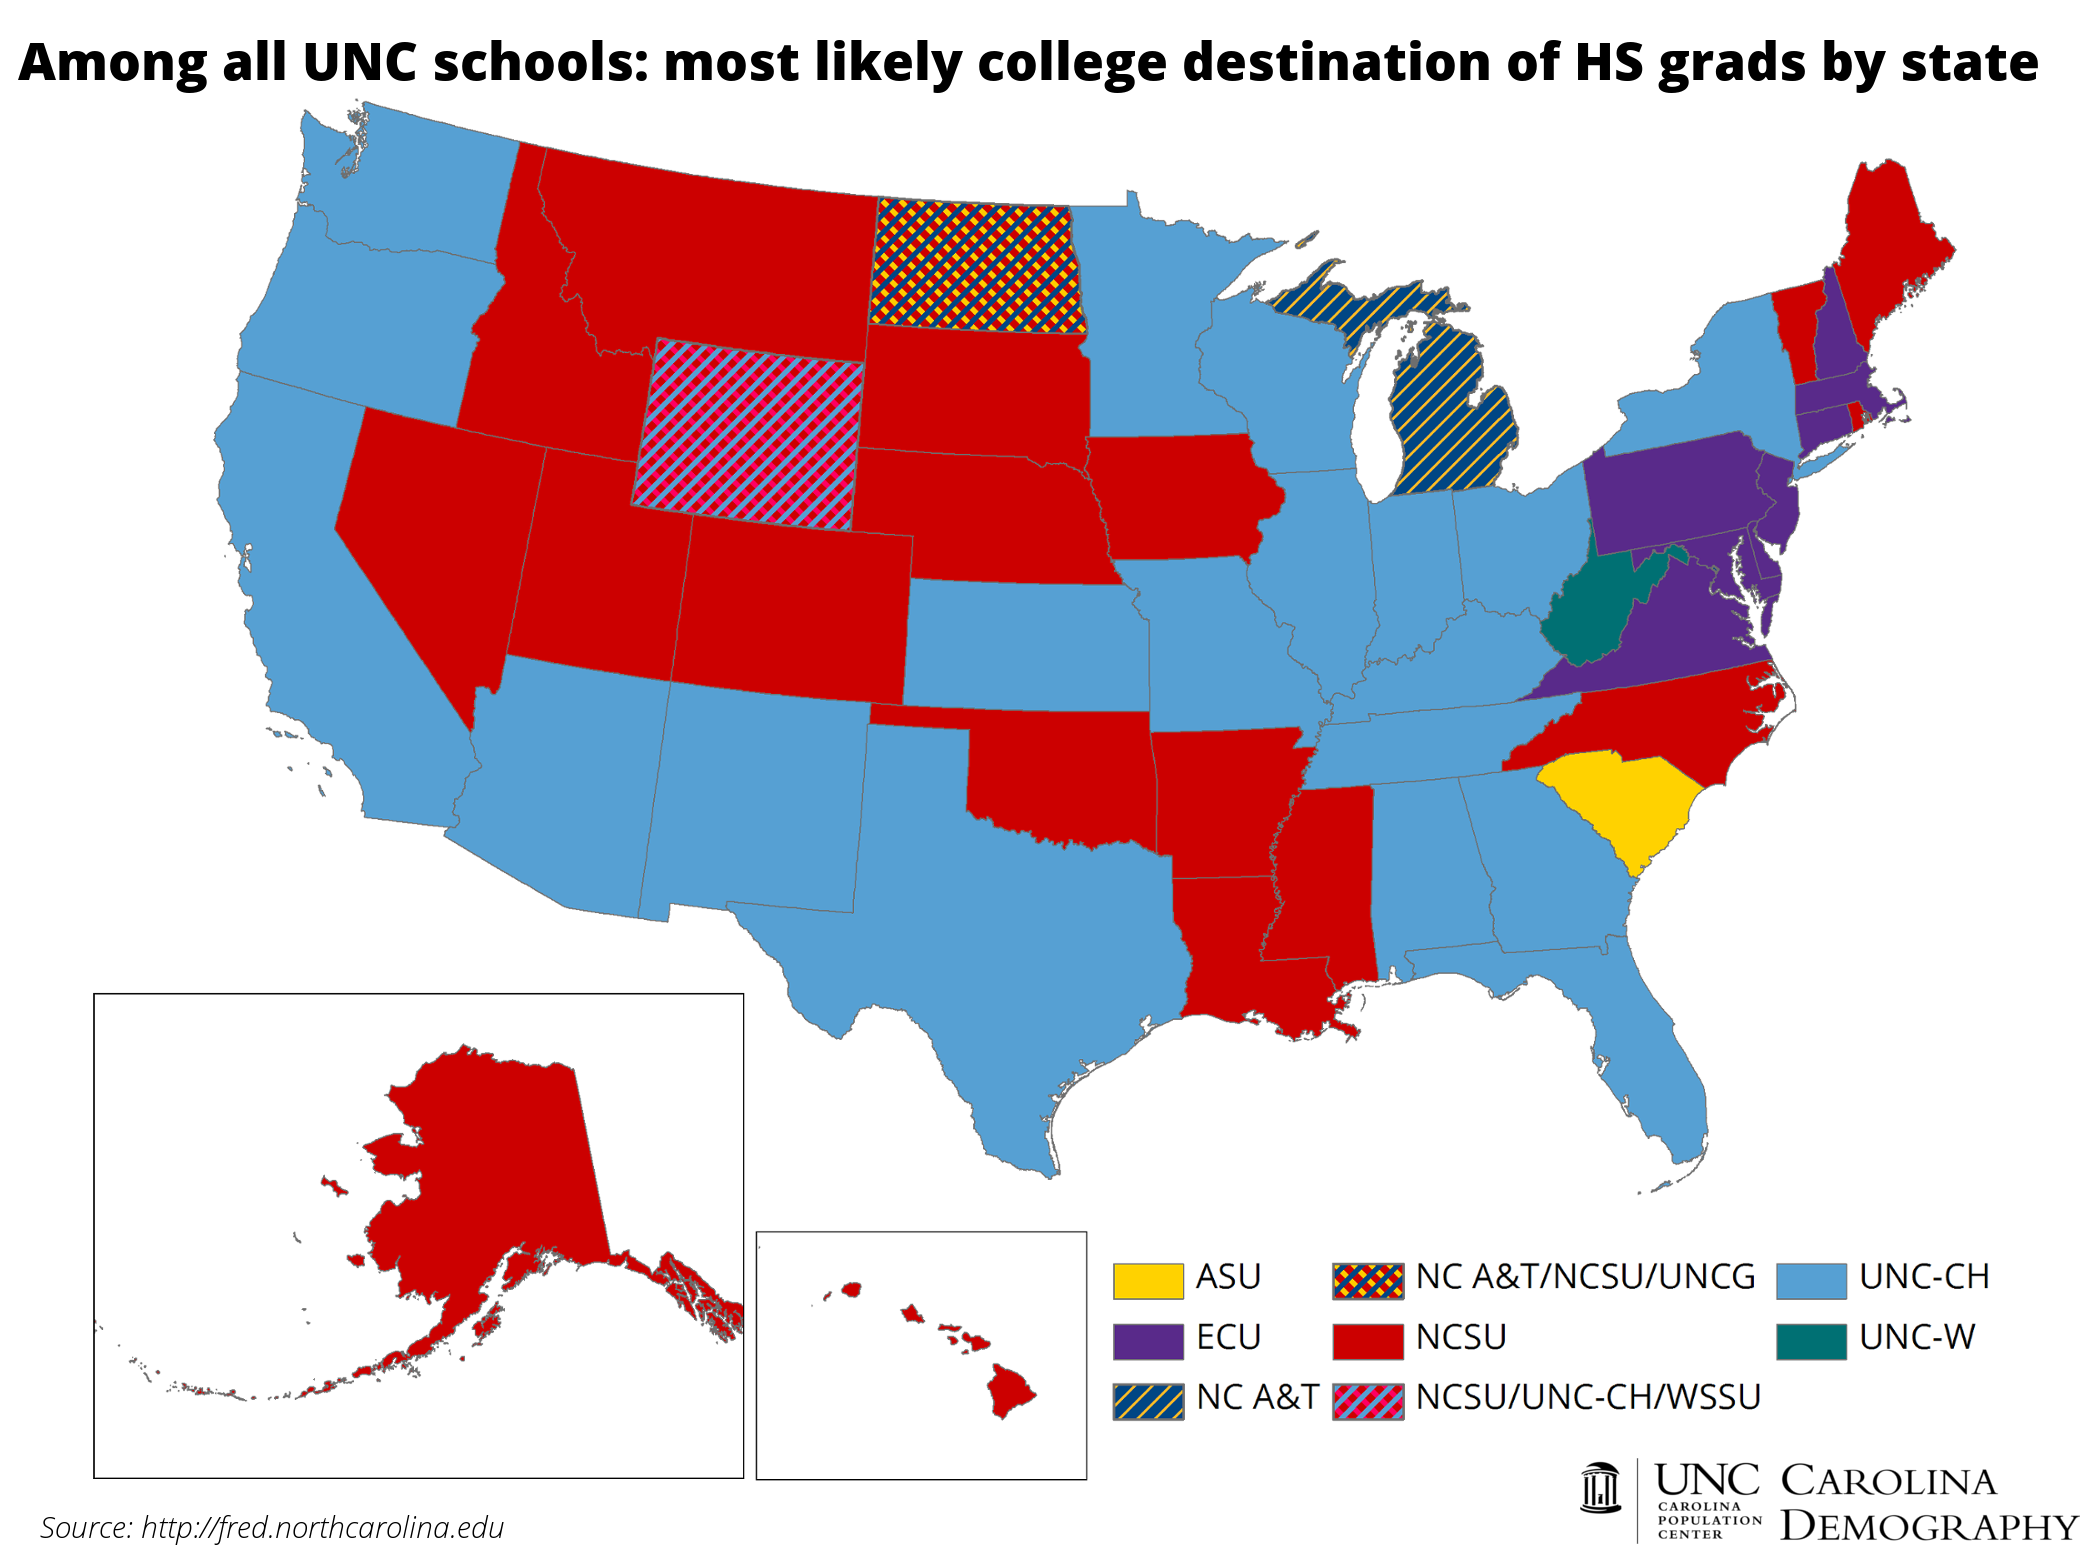
Over the past 5 years, NC State was the only UNC system school that received high school graduates from all 50 states. It is the dominant choice in nearly as many states as UNC-Chapel Hill (18, including North Carolina), and is tied with two other schools in Wyoming and North Dakota. Each year, NC State receives an average of 50 first-year students from Virginia and 40 from New Jersey. While these are the top two sending states to NCSU, they send even more students to East Carolina. The third largest flow of out-of-state students is from Utah, sending an average of 37 first-year students to NC State each fall. Among recent high school graduates from Utah who attend a UNC system school, nearly all (96%) attend NC State.
Though East Carolina purple is not as dominant as it was on the county map, appearing in only 8 states, the average annual flows of out-of-state high school graduates to the university are large. East Carolina receives more than 600 new high school graduates from out-of-state each fall; only UNC-Chapel Hill receives a larger number. Nearly a third of these first-year students come from Virginia (about 205 each year), another 107 from Maryland, and 100 from New York. Since 2009, no high school graduate from Idaho, New Mexico, North Dakota, Oklahoma, South Dakota, Utah, or Wyoming has attended ECU as a first-year student.
Appalachian State’s largest flows of out-of-state students are from Georgia, Virginia, and South Carolina, but it is the dominant destination only among high school graduates from South Carolina. UNC-Charlotte does not dominate any state. Instead, two smaller universities appear on the map: UNC-Wilmington is the most likely choice of first-year students from West Virginia and NC A&T is the most likely destination of first-year students from Michigan and the District of Columbia. The plaid patterns in North Dakota and Wyoming do not represent large flows of students into North Carolina. Only 3 high school graduates from these states have attended a UNC system school since 2009, and each went to a different school!
Accounting for Private Schools
State schools have a mission of serving in-state students, and the map changes colors if we include private schools in the analysis. Although there are many private colleges and universities within the state, Duke, Elon, High Point, and Wake Forest are the only four large enough to influence the analysis.
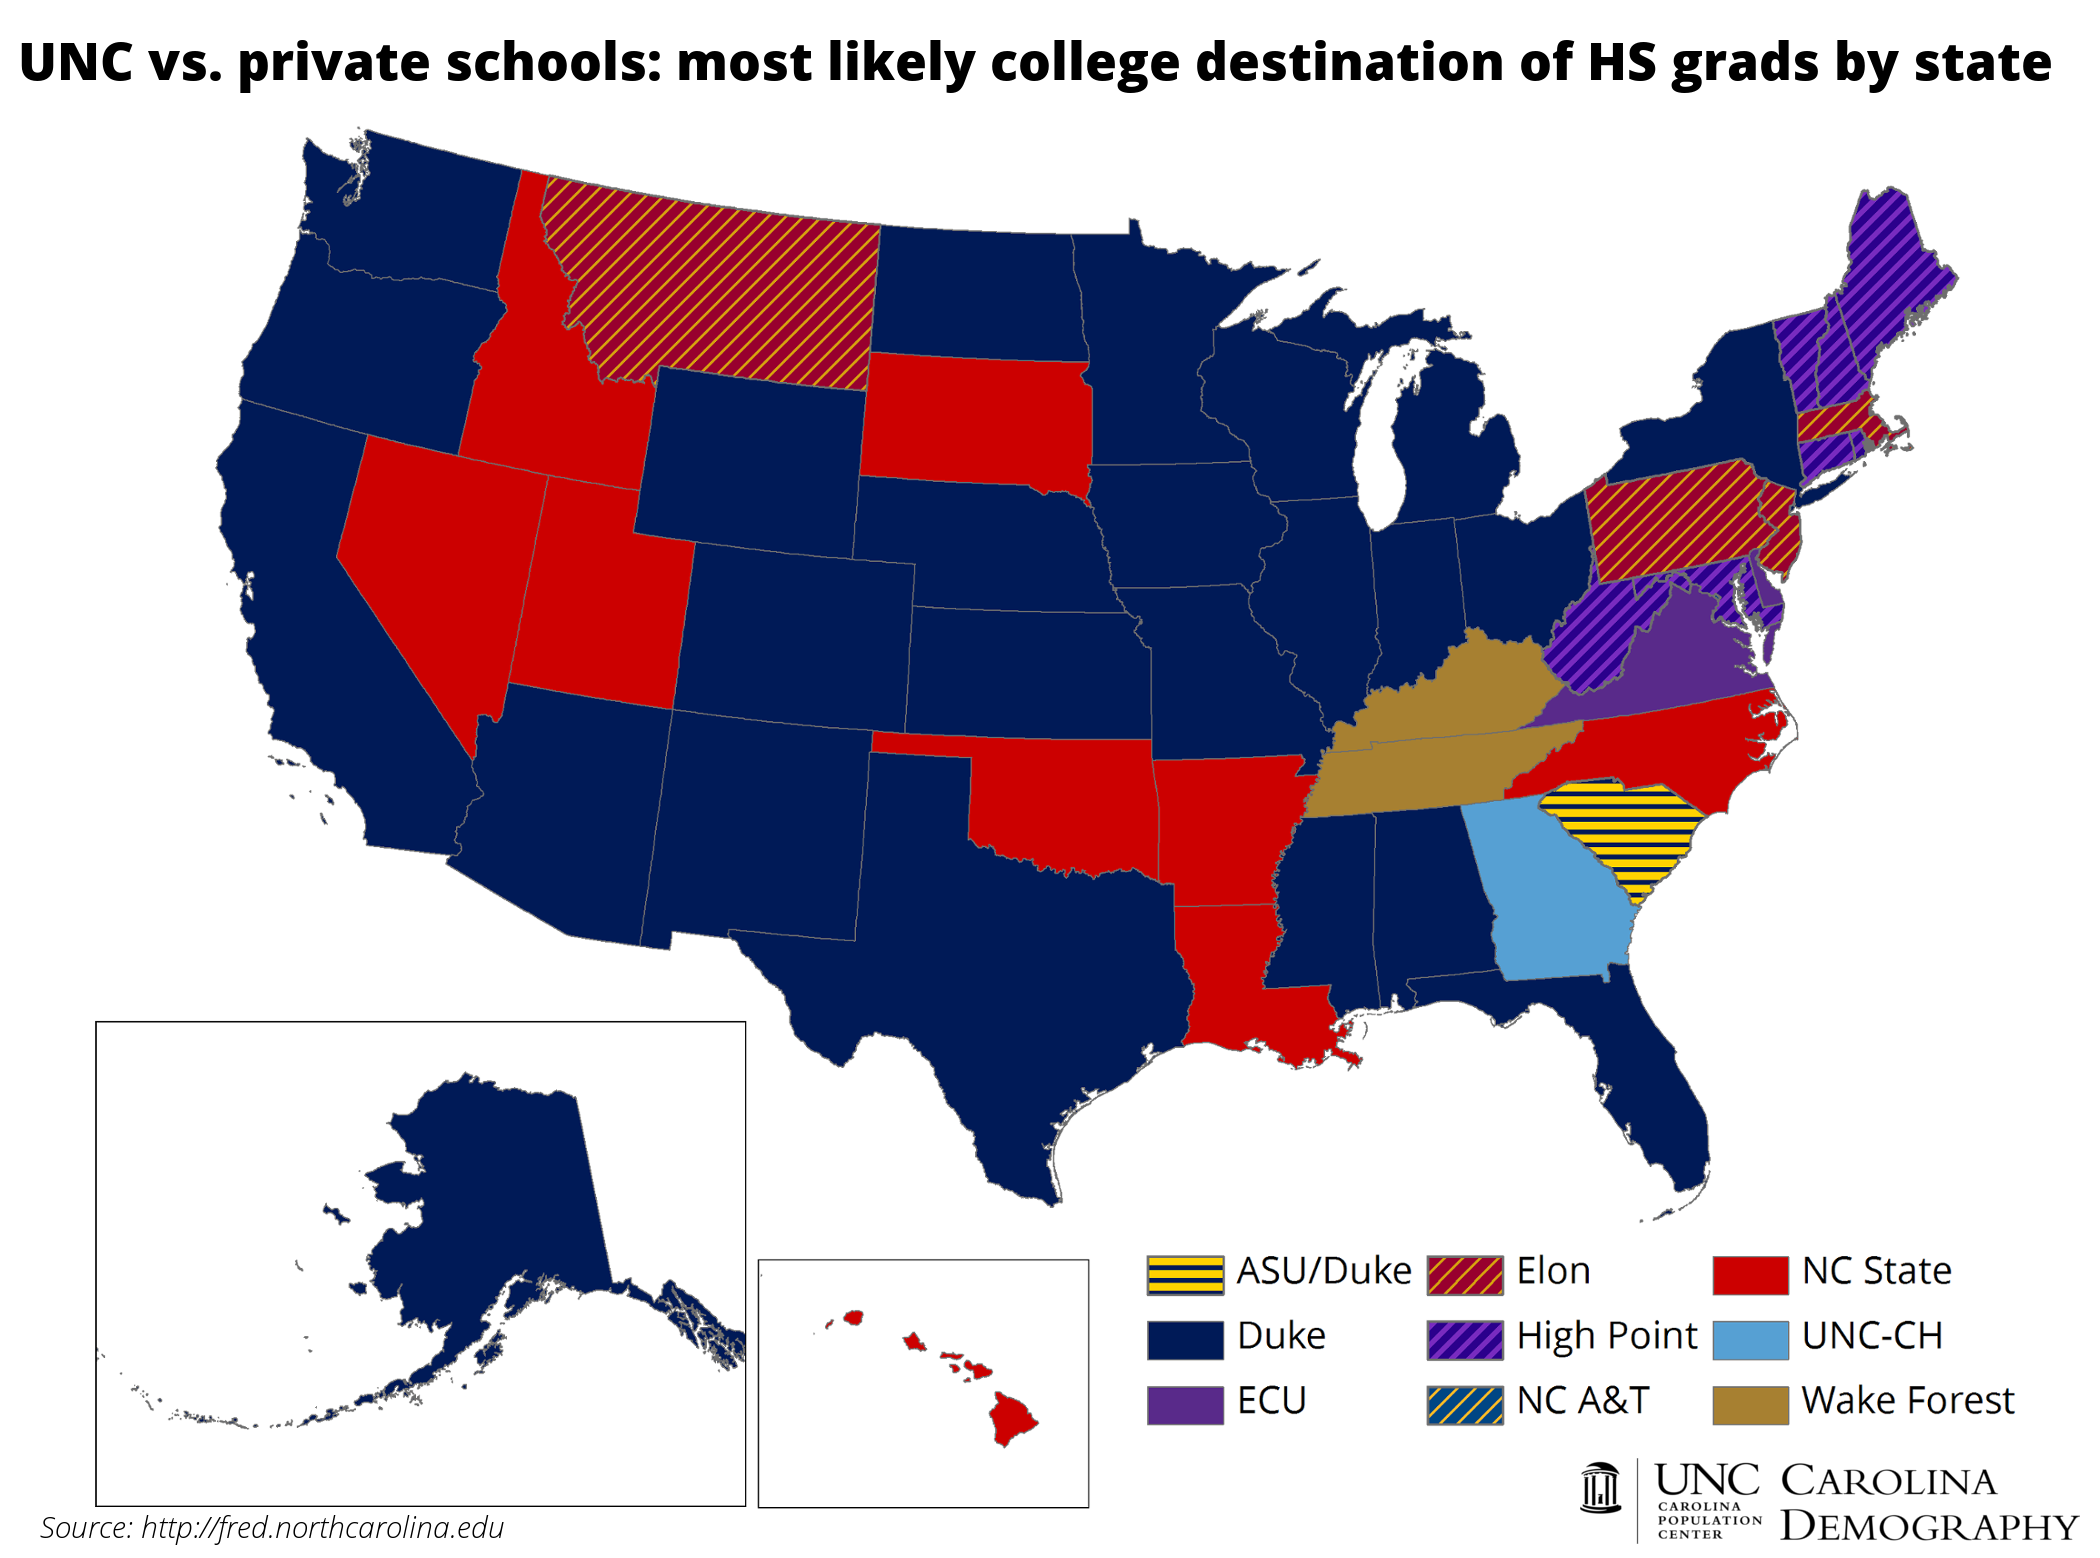
With the exception of Georgia, Carolina blue is now absent from the map. It is replaced by Duke blue everywhere except Tennessee and Kentucky, where high school graduates are most likely to go to Wake Forest. Wolfpack red still dominates 9 states, East Carolina purple appears in Virginia and Delaware, students from South Carolina are equally likely to attend Appalachian State or Duke, and high school students in D.C. remain most likely to attend NC A&T.
Duke is the most likely destination for high school graduates from 24 states. And, contrary to popular belief, all Duke students are not from New Jersey! The top five sending states to Duke are North Carolina, sending an average of 203 first-year students to Duke each fall, California (159 students), New York (147), Florida (131), and New Jersey (93). Since 2009, Duke has received high school graduates from every state.
Over the past 5 years, high school graduates from New Jersey have been most likely to go to Elon; on average, 120 first-year students from New Jersey begin at Elon each fall. Elon is also the top choice for students from Massachusetts, Montana, and Pennsylvania. Since 2009, Elon has received high school graduates from every state except North and South Dakota.
High Point University is the most likely North Carolina college destination for high school students from nearly every New England state. It is also the dominant destination for graduates in West Virginia and Maryland. In contrast, High Point has received few, if any, students from western states in the past 5 years.
Though North Carolina receives more students from some states than others, and each university has its own unique geographic footprint, one thing is clear: each year, North Carolina universities receive thousands of high achieving students from other states. And, once they are here, they might be here to stay.
Note: Data for Wake Forest were only available for 2013. Data for High Point University were unavailable for 2009 and 2011.
Your support is critical to our mission of measuring, understanding, and predicting population change and its impact. Donate to Carolina Demography today.