NC College Bound: An Update
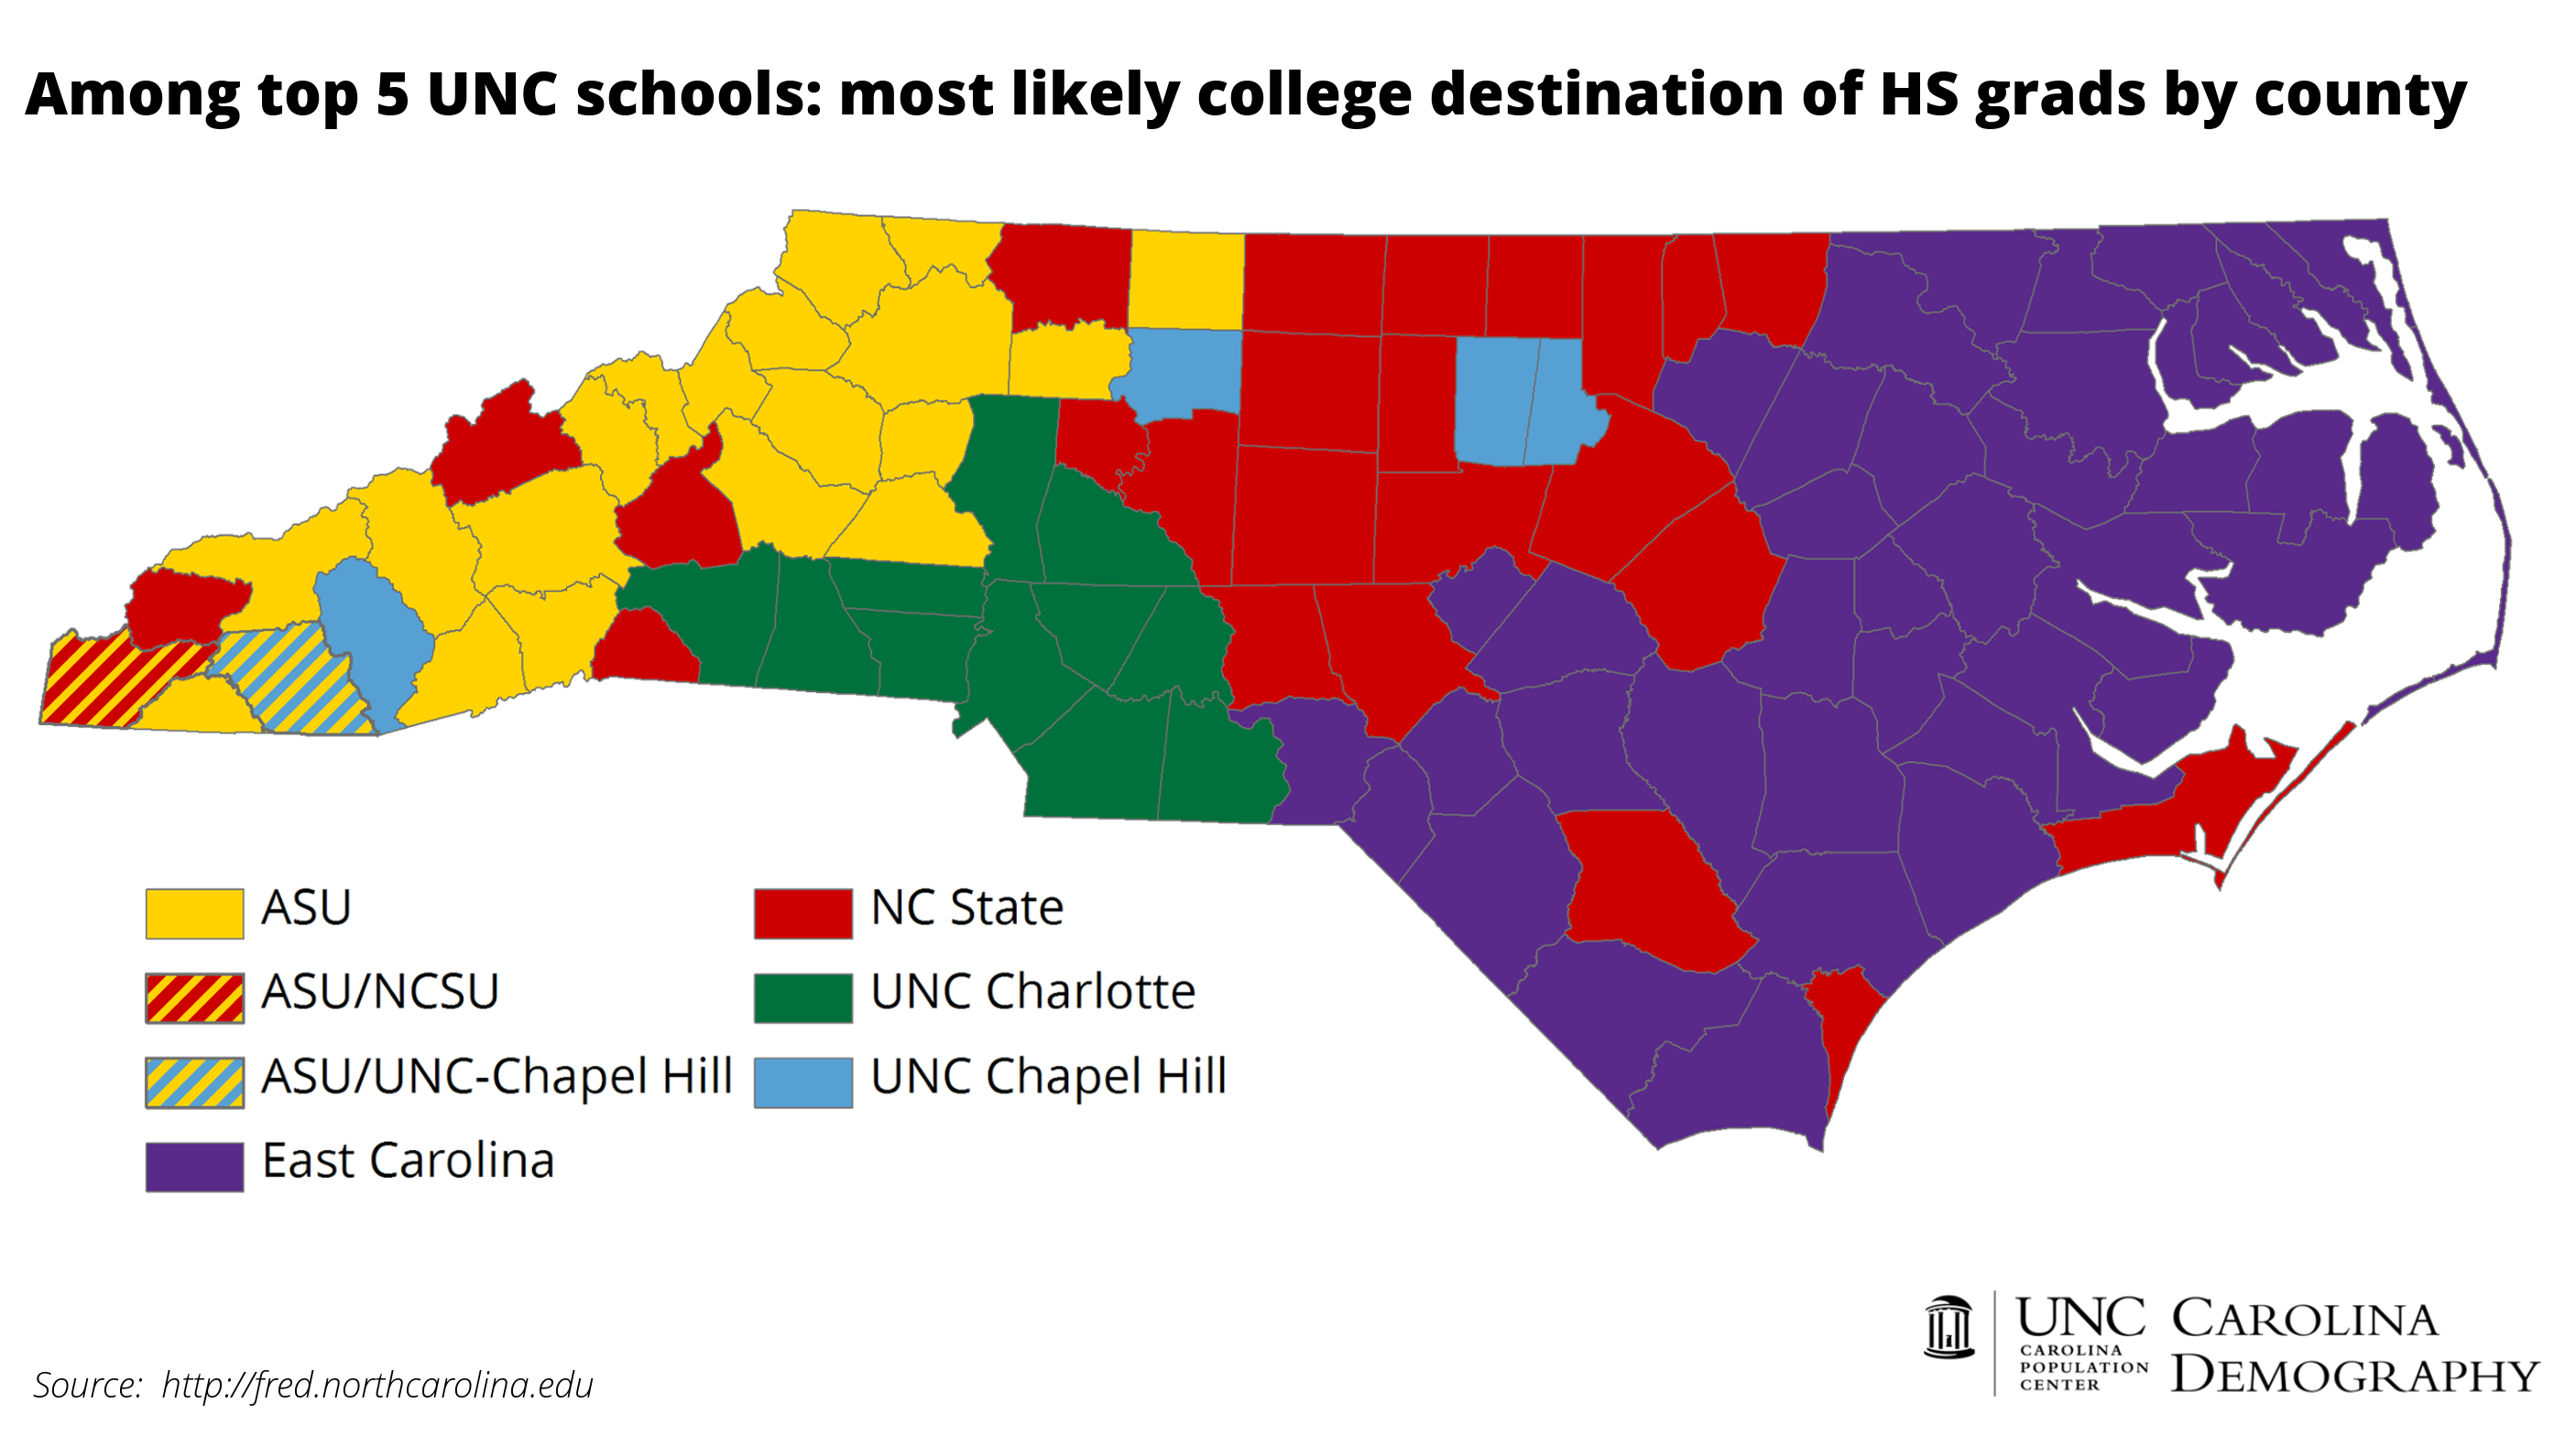
On Monday, we took a county-by-county look at high school graduates’ most likely college destination among North Carolina’s 5 largest public universities. The map was East Carolina purple for 40 eastern counties, Appalachian State gold to the west, UNC-Charlotte green in Mecklenburg and surrounding counties, and NC State red in the piedmont (and a few counties to the east and west, as well). Because UNC-Chapel Hill pulls broadly from all counties but has a smaller first-year class and lower proportion of in-state students, Carolina blue was sparse on the map.
What happens if we expand Monday’s analysis to include all UNC schools, not just the 5 largest? A much more colorful map emerges, with more clearly defined regions.
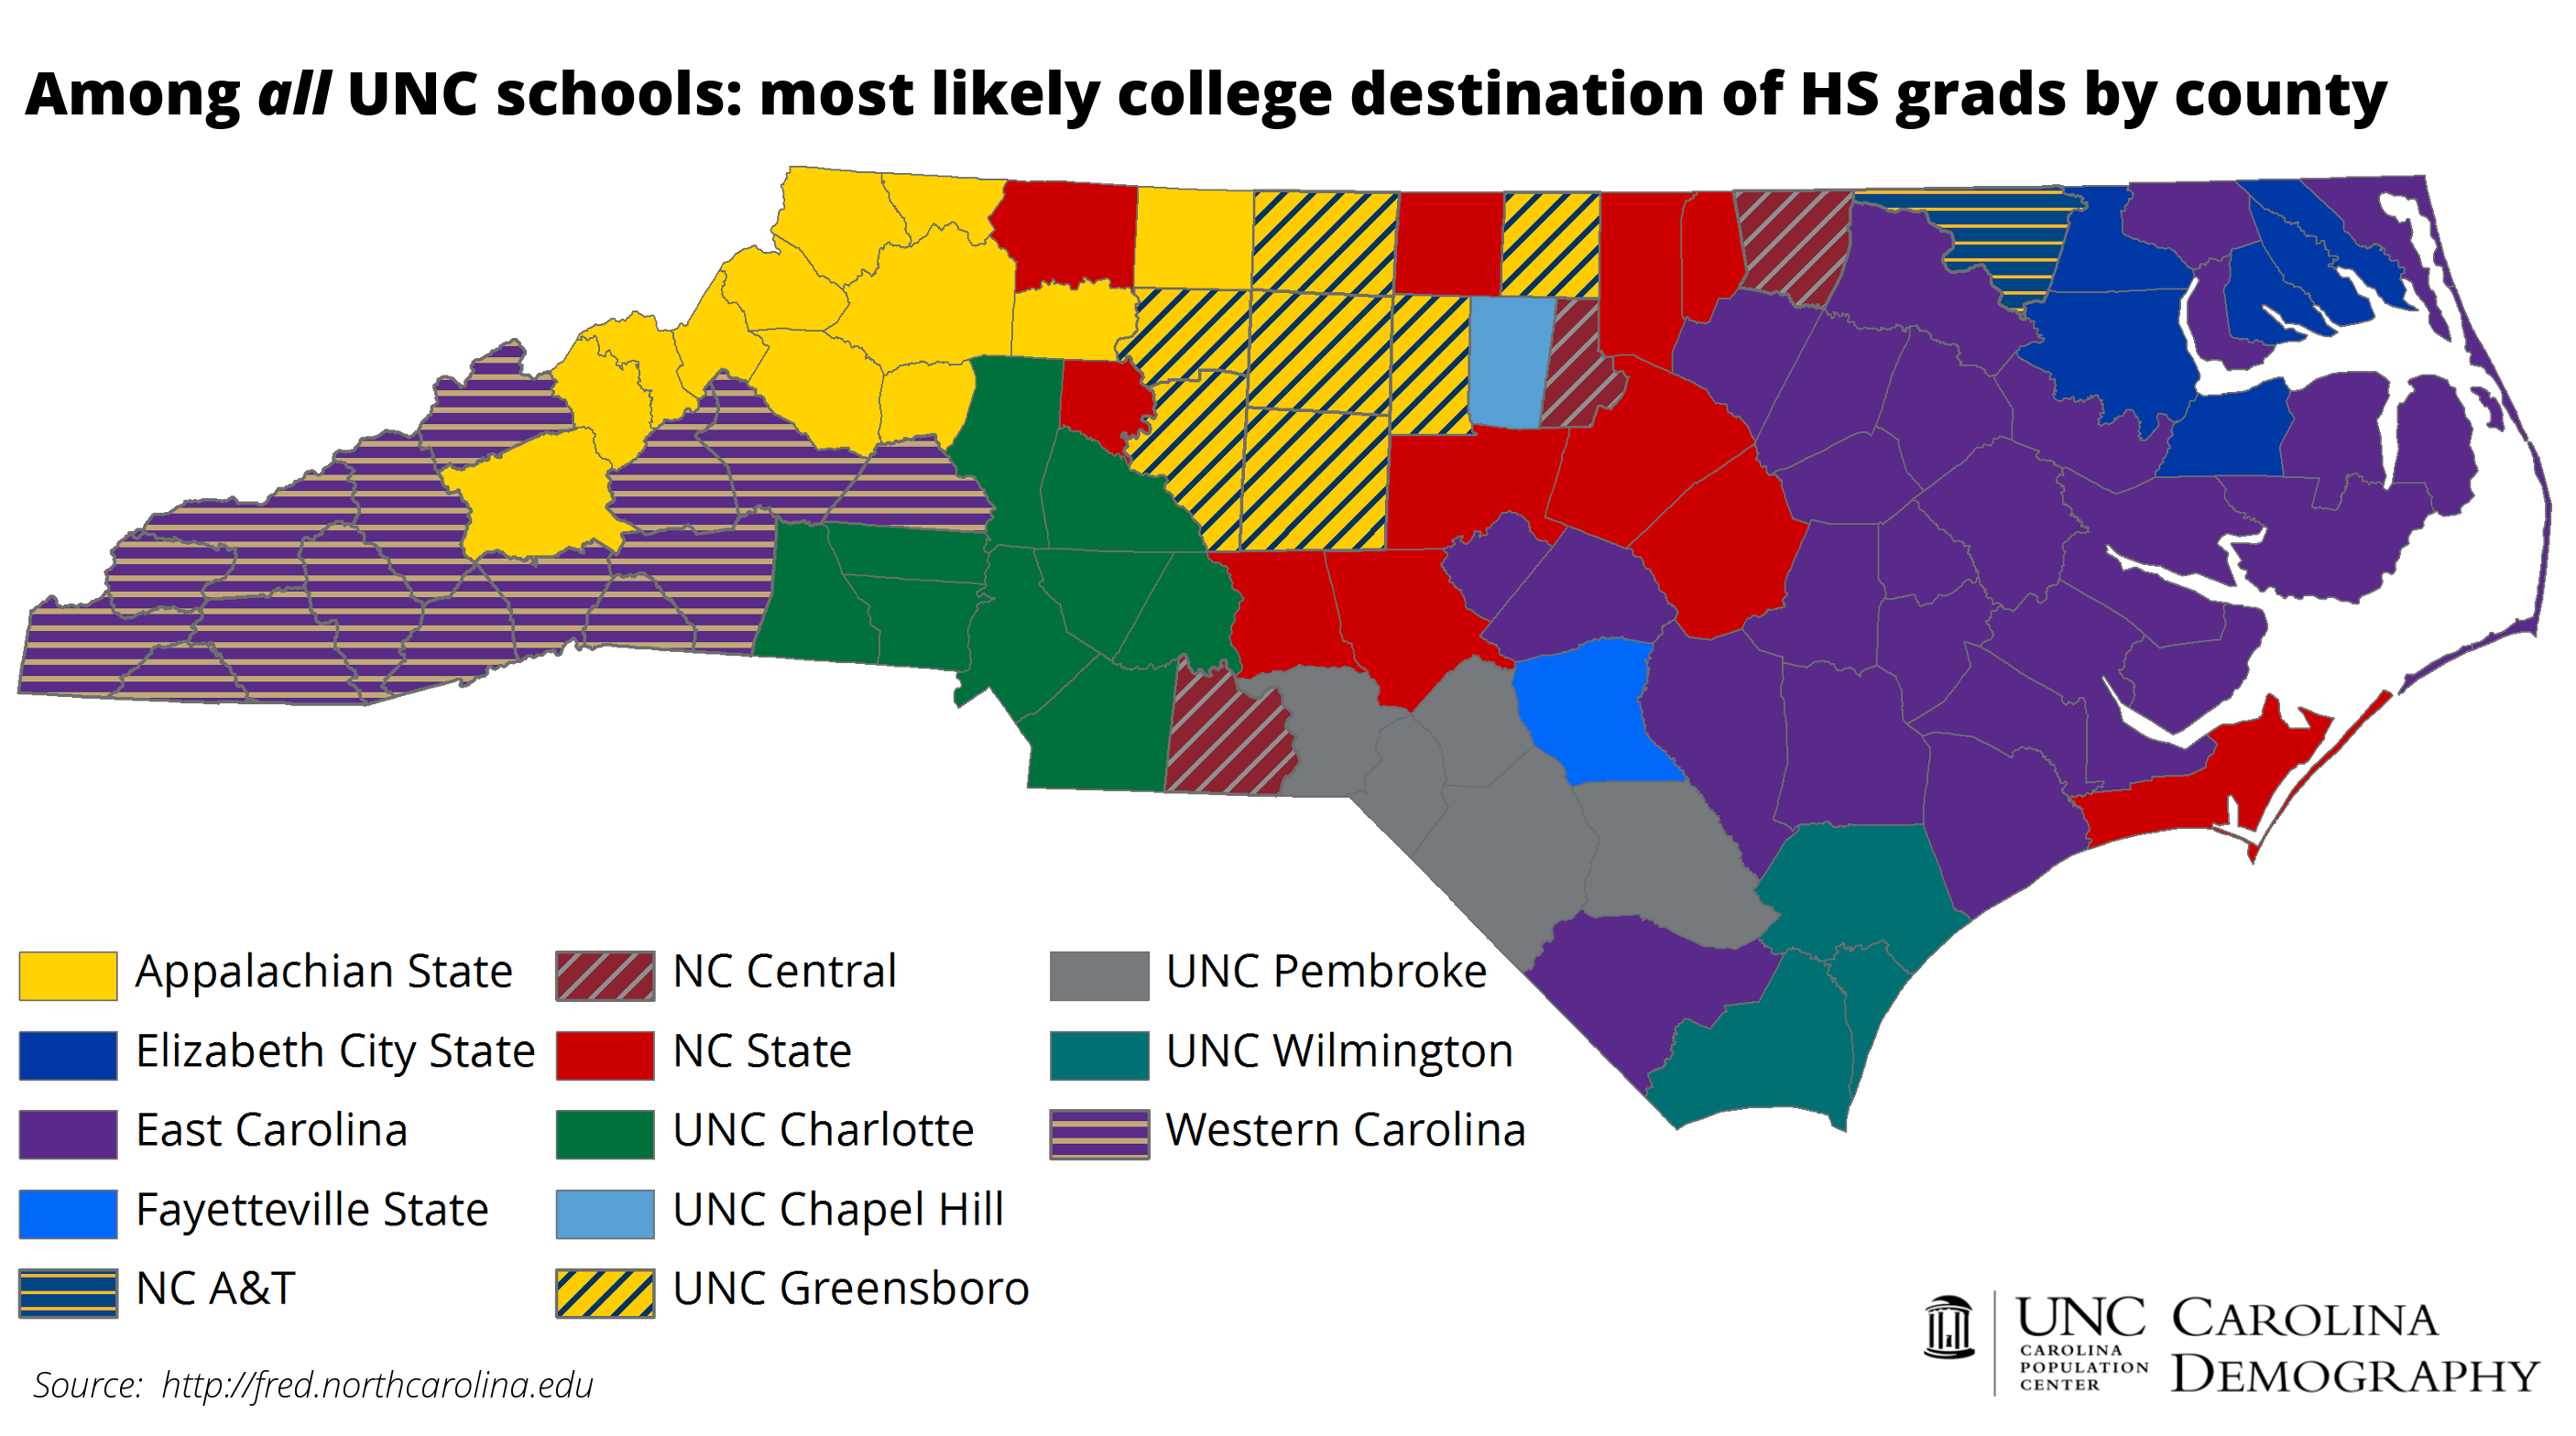
East Carolina purple still colors the most counties on the map–26–but UNC-Pembroke, UNC-Wilmington, Fayetteville State, and Elizabeth City State now carve out their own regions. To the far west, Western Carolina purple and gold dominates. NC Central emerges as the main destination in its home county, Durham, and, UNC Greensboro displaces NC State and UNC-Chapel Hill as the leading college destination in the Triad (Greensboro, Winston-Salem, and High Point). Carolina blue is now only visible in Orange County.
Absent from this map are UNC-Asheville and Winston-Salem State. In Buncombe, UNC-Asheville’s home county, UNCA is the 4th most common destination after Appalachian State, UNC-Chapel Hill, and Western Carolina. Winston-Salem State barely cracks the top 5 in any county: it is tied with NC State as the 4th most common destination for high school graduates in Warren County and is the 5th most common destination for college-bound graduates from Lenoir County.
While this map is limited to data from four-year, public universities, including the four-year private universities in the state would do little to change the dominant destination. Attendance patterns might look different if we were to include data for two-year public institutions, but these data were not available.
Your support is critical to our mission of measuring, understanding, and predicting population change and its impact. Donate to Carolina Demography today.