Due to decade-to-decade changes in municipal boundaries and Census tabulation boundaries, examining housing change over time at the sub-county level can be very difficult. To overcome these challenges, Carolina Demography used 2010 Census and 2006-2011 American Community Survey data to calculate historic estimates of housing units in North Carolina for each decade back to 1940 for all 6,155 Census block groups and 2,195 Census tracts in the state. These data allow us to examine, in detail, how housing unit development spreads across geographies and over time at a very fine-grained level. Today, I wanted to look at the decade during which housing units changed the most for each Census tract.
North Carolina has grown steadily since 1940. Figure 1 shows changes in housing units and total population for each decade over the past 70 years. Because housing unit growth typically mirrors population growth, but at a lower volume, with about 1 housing unit for every 1.7 persons, the left-hand axis corresponds to housing unit change (the blue bars) while the right-hand axis corresponds to population change (the orange line).
Figure 1. North Carolina Housing Unit and Population Change by Decade, 1940-2010
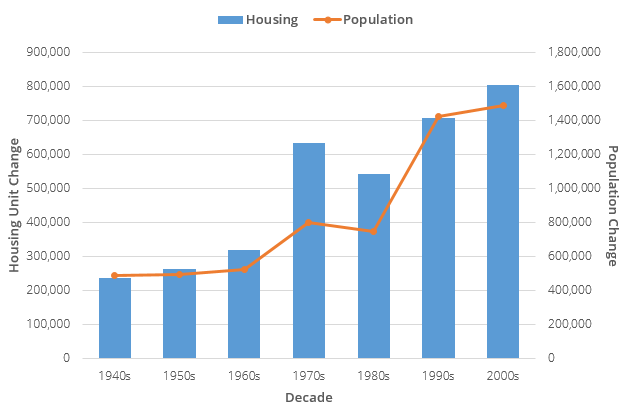
Between 1940 and 1970, population increased by about half a million each decade, from 3.6 to 5.1 million, and housing units rose from 821,000 to 1.64 million units. North Carolina’s population growth accelerated between 1970 and 1980, with about 800,000 new residents. At the same time, housing construction boomed, driven by population growth and new vacation developments in the Outer Banks; 634,000 new units were added over the decade, a 39% increase in housing between 1970 and 1980. Both population growth and housing unit construction ebbed slightly in the 1980s, but were followed by large and sustained growth between 1990 and 2010.
Figure 2 shows the peak construction decade—that is, the decade in which the greatest number of new housing units were added—for each of North Carolina’s 2,195 Census tracts. (A small subset of tracts have no housing units, e.g., military bases, and are identified by a blank spot on the map).
Figure 2. Peak Construction Decade for NC Census Tracts, 1940-2010
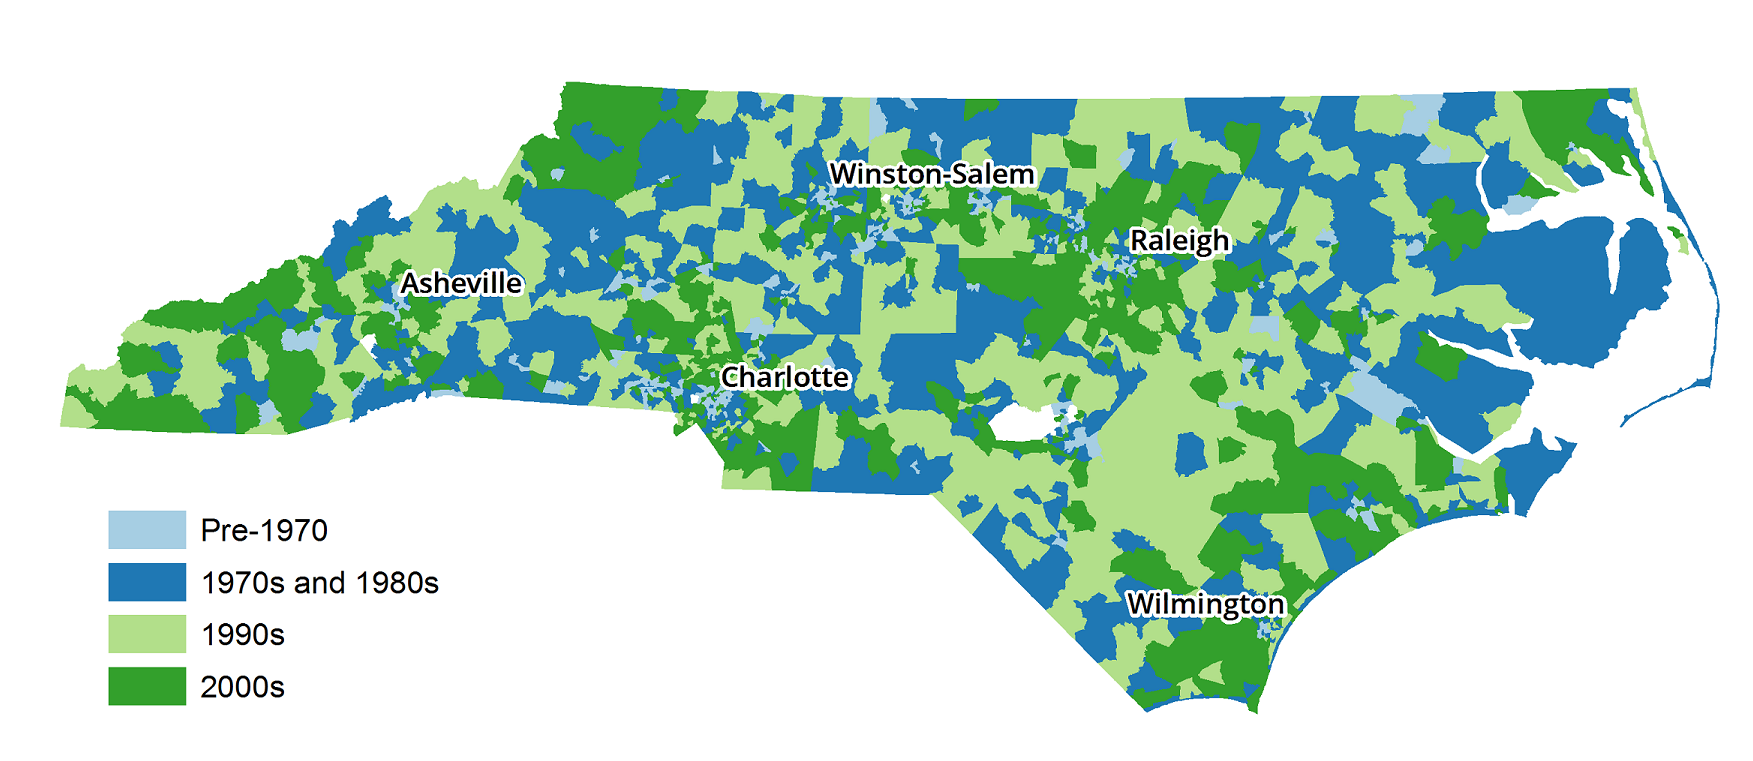
Patterns of construction vary substantially both across the state and within specific areas. While it is difficult to fully discern at this scale, a large proportion of census tracts with peak development decades between 1940 and 1970 are in the central cities of Charlotte, Winston-Salem, Greensboro, and Raleigh. Neighboring areas began to grow in the 1970s and 1980s. Growth continued to expand outward from the urban centers as suburban tracts experienced their peak development in the 1990s and 2000s.
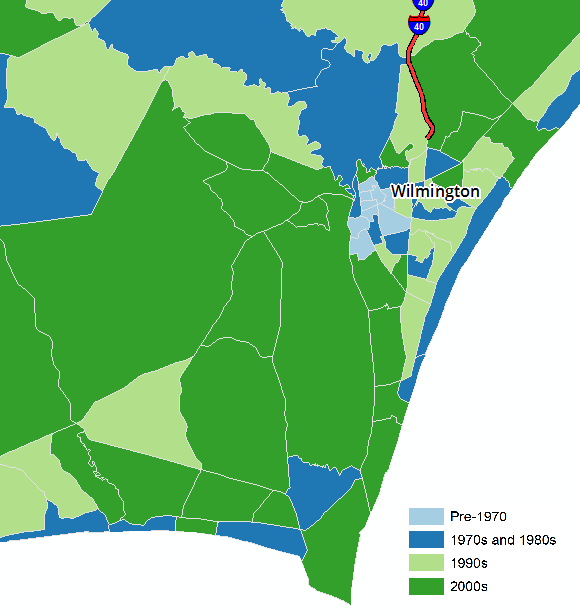
The peak construction time period for the majority of coastal tracts was 1970-1989, reflecting the development of this area as a tourist destination during this time. The light and dark green shadings highlight substantial suburban growth around Charlotte and Raleigh over the past two decades. Similar patterns can be seen around Wilmington (particularly in Brunswick County, south of Wilmington) and the northeastern counties of North Carolina that are part of the Virginia Beach-Norfolk metropolitan area in neighboring Virginia. Western North Carolina also experienced significant development in the 1990s and 2000s, reflecting both its continued appeal as a vacation destination and its emergence as a retiree haven.
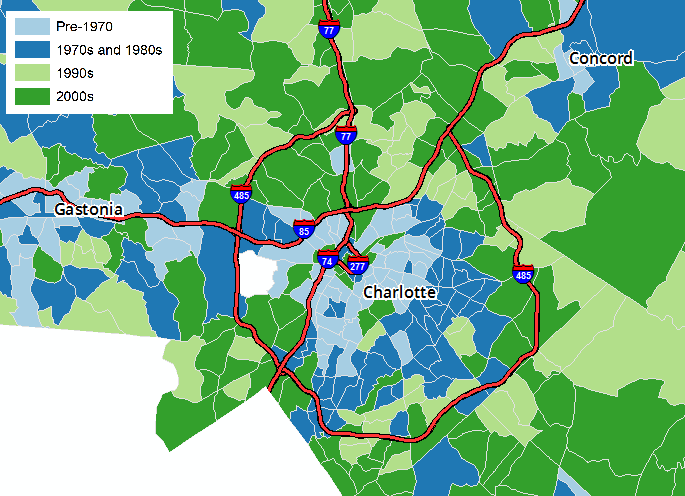
Zooming in to major metropolitan regions provides a visual representation of the past 70 years of development and population growth. In Charlotte (Figure 3), for example, we can see that the peak construction decade for a large portion of the inner city was prior to 1970. During the 1970s and 1980s, the city expanded south and east, as well as to the west toward Gastonia. The 1990s and 2000s saw significant growth in the northern suburbs and the suburbs outside of the 485 beltway. Pockets of lightand dark green within the beltway may represent urban redevelopment efforts.
Figure 3. Peak Construction Decade for Charlotte, NC Census Tracts, 1940-2010
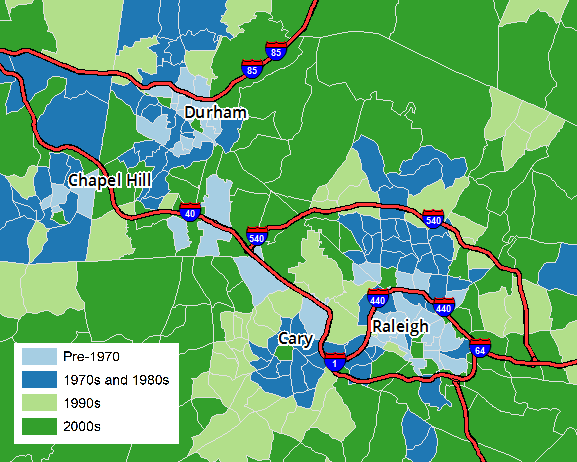
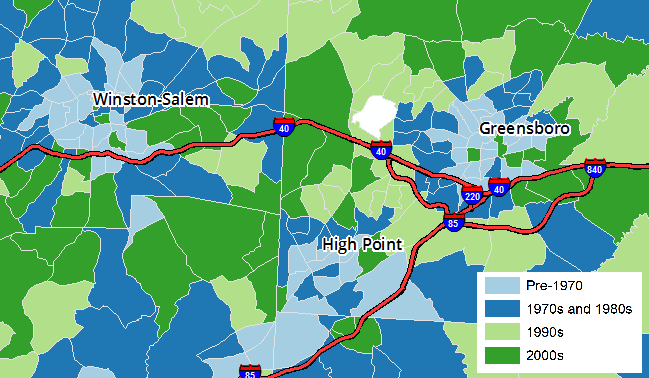
Similar patterns exist in North Carolina’s other major metropolitan areas.
The Triangle:
The Triad:
Wilmington:
Each of these maps highlight patterns of development that share many commonalities but are ultimately highly local, reflecting local development plans and zoning policies, as well as the underlying infrastructure and population. While Carolina Demography produced projections through 2050 that highlight one way in which housing units may continue to grow over time, the patterns that ultimately emerge are strongly influenced by policy and planning at the local level.
Your support is critical to our mission of measuring, understanding, and predicting population change and its impact. Donate to Carolina Demography today.